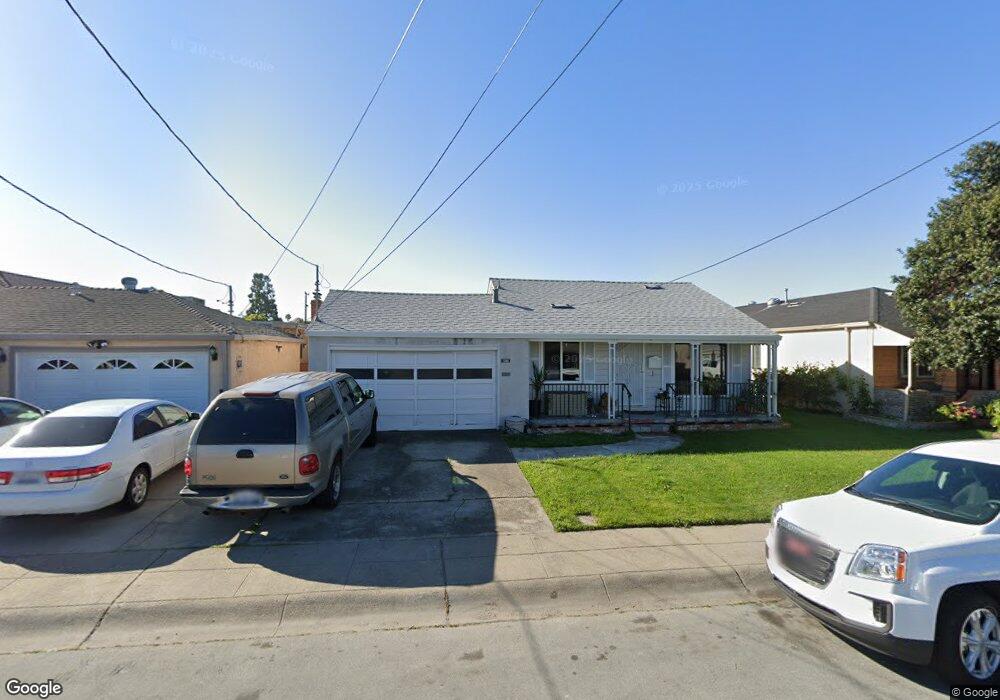
1396 Via Vista San Lorenzo, CA 94580
Estimated Value: $819,410 - $907,000
4
Beds
3
Baths
1,551
Sq Ft
$554/Sq Ft
Est. Value
About This Home
This home is located at 1396 Via Vista, San Lorenzo, CA 94580 and is currently estimated at $858,853, approximately $553 per square foot. 1396 Via Vista is a home located in Alameda County with nearby schools including Bay Elementary School, Bohannon Middle School, and Arroyo High School.
Ownership History
Date
Name
Owned For
Owner Type
Purchase Details
Closed on
Aug 23, 2019
Sold by
Collett David and Collett Debbie
Bought by
Liu Canming and Yu Jingjia
Current Estimated Value
Home Financials for this Owner
Home Financials are based on the most recent Mortgage that was taken out on this home.
Original Mortgage
$450,000
Outstanding Balance
$394,924
Interest Rate
3.8%
Mortgage Type
New Conventional
Estimated Equity
$463,929
Purchase Details
Closed on
Jul 25, 2011
Sold by
Martin Mary E
Bought by
Collett David and Collett Debbie
Home Financials for this Owner
Home Financials are based on the most recent Mortgage that was taken out on this home.
Original Mortgage
$260,000
Interest Rate
4.46%
Mortgage Type
New Conventional
Purchase Details
Closed on
Jan 10, 2007
Sold by
Hughey Ruth
Bought by
Hughey Ruth
Create a Home Valuation Report for This Property
The Home Valuation Report is an in-depth analysis detailing your home's value as well as a comparison with similar homes in the area
Home Values in the Area
Average Home Value in this Area
Purchase History
| Date | Buyer | Sale Price | Title Company |
|---|---|---|---|
| Liu Canming | $650,500 | Chicago Title Company | |
| Collett David | $325,000 | Placer Title Company | |
| Hughey Ruth | -- | None Available |
Source: Public Records
Mortgage History
| Date | Status | Borrower | Loan Amount |
|---|---|---|---|
| Open | Liu Canming | $450,000 | |
| Previous Owner | Collett David | $260,000 |
Source: Public Records
Tax History Compared to Growth
Tax History
| Year | Tax Paid | Tax Assessment Tax Assessment Total Assessment is a certain percentage of the fair market value that is determined by local assessors to be the total taxable value of land and additions on the property. | Land | Improvement |
|---|---|---|---|---|
| 2025 | $10,169 | $763,897 | $213,257 | $550,640 |
| 2024 | $10,169 | $748,922 | $209,077 | $539,845 |
| 2023 | $10,094 | $734,239 | $204,978 | $529,261 |
| 2022 | $9,931 | $719,843 | $200,959 | $518,884 |
| 2021 | $9,648 | $705,733 | $197,020 | $508,713 |
| 2020 | $8,476 | $650,000 | $195,000 | $455,000 |
| 2019 | $4,196 | $293,024 | $91,676 | $201,348 |
| 2018 | $3,932 | $287,280 | $89,879 | $197,401 |
| 2017 | $3,755 | $281,648 | $88,117 | $193,531 |
| 2016 | $3,579 | $276,127 | $86,390 | $189,737 |
| 2015 | $3,499 | $271,981 | $85,093 | $186,888 |
| 2014 | $3,446 | $266,653 | $83,426 | $183,227 |
Source: Public Records
Map
Nearby Homes
- 1338 Via la Paloma
- 1311 Via Manzanas
- 1575 Via Lucas
- 16050 Via Olinda
- 17069 Via Chiquita
- 0 E 14th St Unit 41059501
- 1608 Keller Ave
- 15967 Paseo Del Campo
- 1631 Via Ventana
- 1655 Via Escondido
- 16011 Via Conejo
- 1766 Via Redondo
- 1781 Via Rancho
- 17354 Via el Cerrito
- 17316 Via Flores
- 17347 Via Encinas
- 15771 Via Nueva
- 987 Via Bregani
- 1867 Via Buena Vista
- 638 Paseo Del Rio
- 1382 Via Vista
- 1382 Via Vista
- 1414 Via Vista
- 1368 Via Vista
- 1428 Via Vista
- 1428 Via Vista
- 1421 Via el Monte
- 1409 Via el Monte
- 1433 Via el Monte
- 1442 Via Vista
- 1442 Via Vista
- 1354 Via Vista
- 1397 Via el Monte
- 1445 Via el Monte
- 1393 Via Vista
- 1411 Via Vista
- 1411 Via Vista
- 1425 Via Vista
- 1381 Via Vista
- 1425 Via Vista