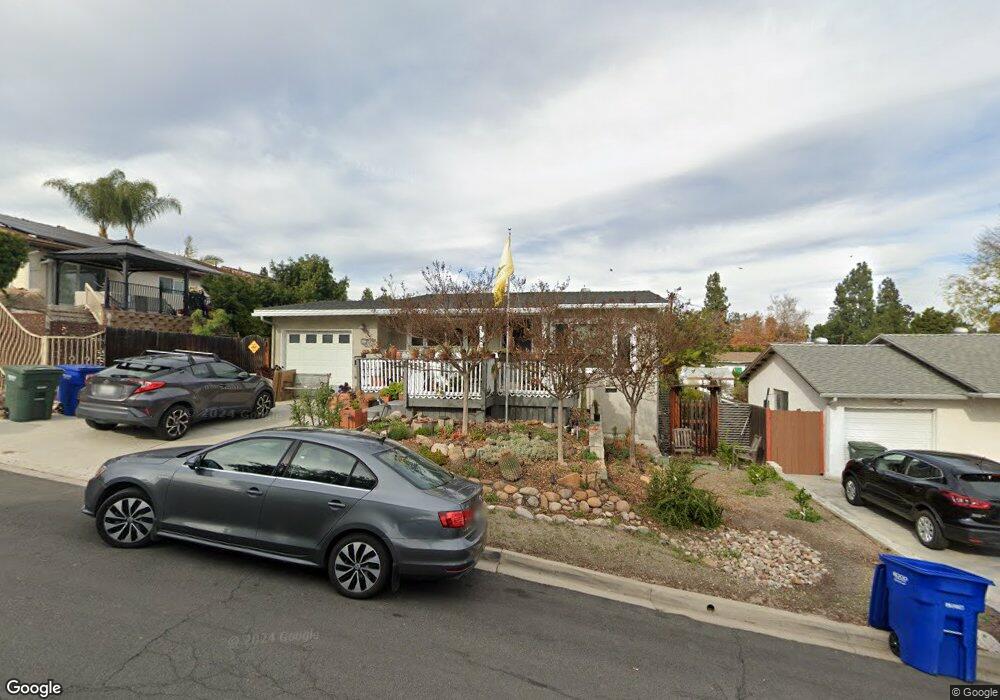
1396 Weers St El Cajon, CA 92020
Fletcher Hills NeighborhoodEstimated Value: $657,274 - $823,000
3
Beds
1
Bath
896
Sq Ft
$806/Sq Ft
Est. Value
About This Home
This home is located at 1396 Weers St, El Cajon, CA 92020 and is currently estimated at $722,569, approximately $806 per square foot. 1396 Weers St is a home located in San Diego County with nearby schools including Flying Hills Elementary School, West Hills High School, and Grossmont Secondary School.
Ownership History
Date
Name
Owned For
Owner Type
Purchase Details
Closed on
Aug 12, 2024
Sold by
Mcmaster Mark R
Bought by
Mark Mcmaster Revocable Trust and Mcmaster
Current Estimated Value
Home Financials for this Owner
Home Financials are based on the most recent Mortgage that was taken out on this home.
Original Mortgage
$110,000
Interest Rate
7.03%
Mortgage Type
New Conventional
Purchase Details
Closed on
Jun 27, 2024
Sold by
Mcmaster Mark R and Lantin Lewbert
Bought by
Mcmaster Mark R
Home Financials for this Owner
Home Financials are based on the most recent Mortgage that was taken out on this home.
Original Mortgage
$110,000
Interest Rate
7.03%
Mortgage Type
New Conventional
Purchase Details
Closed on
Mar 29, 1996
Sold by
Mcmaster Timothy R and Mcmaster Jacquelyn M
Bought by
Mcmaster Mark R
Home Financials for this Owner
Home Financials are based on the most recent Mortgage that was taken out on this home.
Original Mortgage
$100,000
Interest Rate
7.41%
Mortgage Type
Seller Take Back
Purchase Details
Closed on
Nov 9, 1994
Sold by
Mcmaster Timothy R and Mcmaster Jacquelyn M
Bought by
Mcmaster Timothy R and Mcmaster Jacquelyn M
Create a Home Valuation Report for This Property
The Home Valuation Report is an in-depth analysis detailing your home's value as well as a comparison with similar homes in the area
Home Values in the Area
Average Home Value in this Area
Purchase History
| Date | Buyer | Sale Price | Title Company |
|---|---|---|---|
| Mark Mcmaster Revocable Trust | -- | None Listed On Document | |
| Mcmaster Mark R | -- | Ticor Title | |
| Mcmaster Mark R | $100,000 | -- | |
| Mcmaster Timothy R | -- | -- |
Source: Public Records
Mortgage History
| Date | Status | Borrower | Loan Amount |
|---|---|---|---|
| Previous Owner | Mcmaster Mark R | $110,000 | |
| Previous Owner | Mcmaster Mark R | $100,000 |
Source: Public Records
Tax History Compared to Growth
Tax History
| Year | Tax Paid | Tax Assessment Tax Assessment Total Assessment is a certain percentage of the fair market value that is determined by local assessors to be the total taxable value of land and additions on the property. | Land | Improvement |
|---|---|---|---|---|
| 2025 | $2,473 | $166,092 | $99,659 | $66,433 |
| 2024 | $2,473 | $162,836 | $97,705 | $65,131 |
| 2023 | $2,402 | $159,644 | $95,790 | $63,854 |
| 2022 | $2,361 | $156,514 | $93,912 | $62,602 |
| 2021 | $2,281 | $153,446 | $92,071 | $61,375 |
| 2020 | $2,208 | $151,873 | $91,127 | $60,746 |
| 2019 | $1,766 | $148,896 | $89,341 | $59,555 |
| 2018 | $1,736 | $145,978 | $87,590 | $58,388 |
| 2017 | $31 | $143,117 | $85,873 | $57,244 |
| 2016 | $1,642 | $140,312 | $84,190 | $56,122 |
| 2015 | $1,632 | $138,205 | $82,926 | $55,279 |
| 2014 | $1,600 | $135,499 | $81,302 | $54,197 |
Source: Public Records
Map
Nearby Homes
- 731 Dewane Dr
- 1387 Weers St
- 701 El Monte Rd
- 741 N Pierce St
- 370 N Cuyamaca St
- 1340 Heron Ave
- 1673 Hillsmont Dr
- 1681 Hillsmont Dr
- 346 El Monte Rd
- 1958 Milford Place
- 1677 Heron Ave
- 1280 W Main St Unit 24
- 1280 W Main St Unit 6
- 0 Hacienda Dr
- 589 N Johnson Ave Unit 247
- 589 N Johnson Ave Unit 130
- 1894 Wedgemere Rd
- 198 Croydon Ln
- 2052 Flying Hills Ln
- 168 S Pierce St