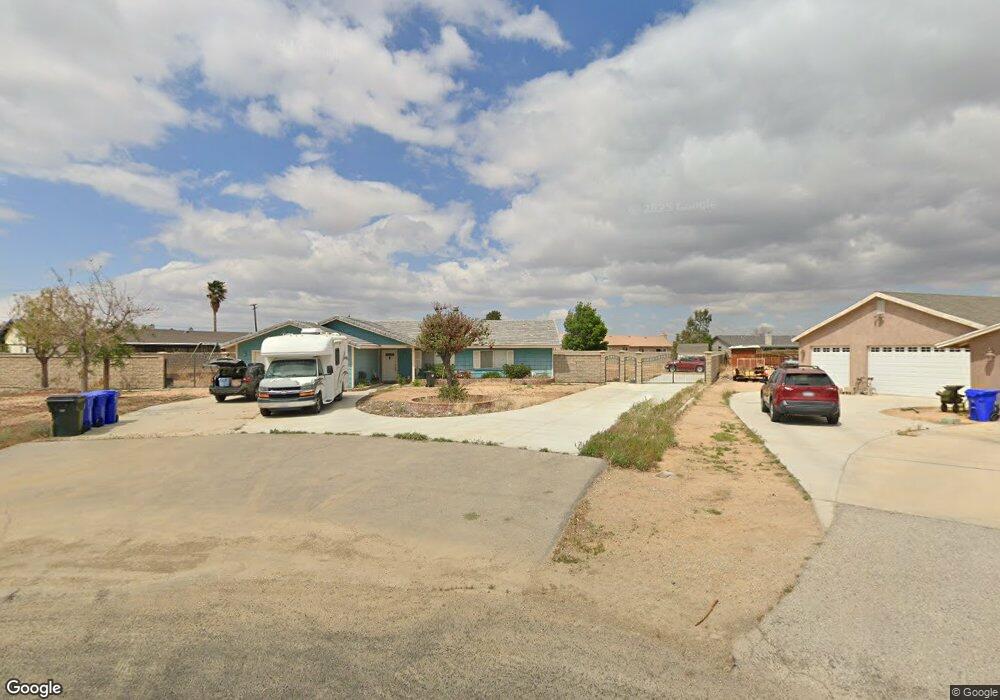
13962 Hudson Ct Apple Valley, CA 92307
High Desert NeighborhoodEstimated Value: $515,000 - $662,000
4
Beds
3
Baths
3,017
Sq Ft
$193/Sq Ft
Est. Value
About This Home
This home is located at 13962 Hudson Ct, Apple Valley, CA 92307 and is currently estimated at $583,006, approximately $193 per square foot. 13962 Hudson Ct is a home located in San Bernardino County with nearby schools including Rio Vista School of Applied Learning, Apple Valley High School, and Academy for Academic Excellence.
Ownership History
Date
Name
Owned For
Owner Type
Purchase Details
Closed on
Jun 11, 2013
Sold by
Chambers Nannette
Bought by
Chambers Nannette and The Nannette Chambers Living T
Current Estimated Value
Purchase Details
Closed on
Jul 28, 2006
Sold by
Chambers Nannette
Bought by
Chambers Nannette
Home Financials for this Owner
Home Financials are based on the most recent Mortgage that was taken out on this home.
Original Mortgage
$315,000
Interest Rate
6%
Mortgage Type
New Conventional
Purchase Details
Closed on
Jun 14, 2004
Sold by
Chambers Randy
Bought by
Chambers Nannette
Home Financials for this Owner
Home Financials are based on the most recent Mortgage that was taken out on this home.
Original Mortgage
$200,000
Interest Rate
6.27%
Mortgage Type
New Conventional
Purchase Details
Closed on
Sep 24, 1999
Sold by
Daigneault Nannette
Bought by
Chambers Randy and Chambers Nannette
Create a Home Valuation Report for This Property
The Home Valuation Report is an in-depth analysis detailing your home's value as well as a comparison with similar homes in the area
Home Values in the Area
Average Home Value in this Area
Purchase History
| Date | Buyer | Sale Price | Title Company |
|---|---|---|---|
| Chambers Nannette | -- | None Available | |
| Chambers Nannette | -- | First American Title Company | |
| Chambers Nannette | -- | Chicago Title Co | |
| Chambers Randy | -- | -- |
Source: Public Records
Mortgage History
| Date | Status | Borrower | Loan Amount |
|---|---|---|---|
| Closed | Chambers Nannette | $315,000 | |
| Closed | Chambers Nannette | $200,000 |
Source: Public Records
Tax History Compared to Growth
Tax History
| Year | Tax Paid | Tax Assessment Tax Assessment Total Assessment is a certain percentage of the fair market value that is determined by local assessors to be the total taxable value of land and additions on the property. | Land | Improvement |
|---|---|---|---|---|
| 2025 | $2,496 | $223,355 | $30,134 | $193,221 |
| 2024 | $2,496 | $218,975 | $29,543 | $189,432 |
| 2023 | $2,471 | $214,682 | $28,964 | $185,718 |
| 2022 | $2,433 | $210,472 | $28,396 | $182,076 |
| 2021 | $2,376 | $206,345 | $27,839 | $178,506 |
| 2020 | $2,346 | $204,230 | $27,554 | $176,676 |
| 2019 | $2,301 | $200,226 | $27,014 | $173,212 |
| 2018 | $2,243 | $196,300 | $26,484 | $169,816 |
| 2017 | $2,211 | $192,451 | $25,965 | $166,486 |
| 2016 | $2,114 | $188,678 | $25,456 | $163,222 |
| 2015 | $2,082 | $185,844 | $25,074 | $160,770 |
| 2014 | $2,003 | $177,792 | $24,583 | $153,209 |
Source: Public Records
Map
Nearby Homes
- 13955 Cuyamaca Rd
- 19145 Shoshonee Rd
- 14405 Mandan Rd
- 18715 Mingo Rd
- 13771 Wawona Rd
- 18475 Trout
- 18490 Trout Ln
- 14455 Havasu Rd
- 13501 Driftwood Dr
- 14118 Monte Verde Ave
- 18286 Lakeview Dr
- 13395 Driftwood Dr
- 18510 Seneca Rd
- 13550 Pyramid Dr
- 19446 Shoshonee Rd
- 18160 Harbor Dr
- 18055 Lakeview Dr
- 13380 Driftwood Dr
- 0 Riverside Dr Unit HD25148269
- 18415 Niagara Dr
- 13964 Hudson Ct
- 18810 Siesta Dr
- 13981 Siesta Rd
- 13958 Hudson Ct
- 18824 Siesta Dr
- 14003 Siesta Rd
- 18845 Shoshonee Rd
- 18855 Shoshonee Rd
- 13968 Hudson Ct
- 14013 Siesta Rd
- 18838 Siesta Dr
- 13952 Hudson Ct
- 18875 Shoshonee Rd
- 18805 Siesta Dr
- 18811 Siesta Dr
- 13970 Siesta Rd
- 18819 Siesta Dr
- 13982 Siesta Rd
- 18846 Shoshonee Rd
- 14002 Siesta Rd