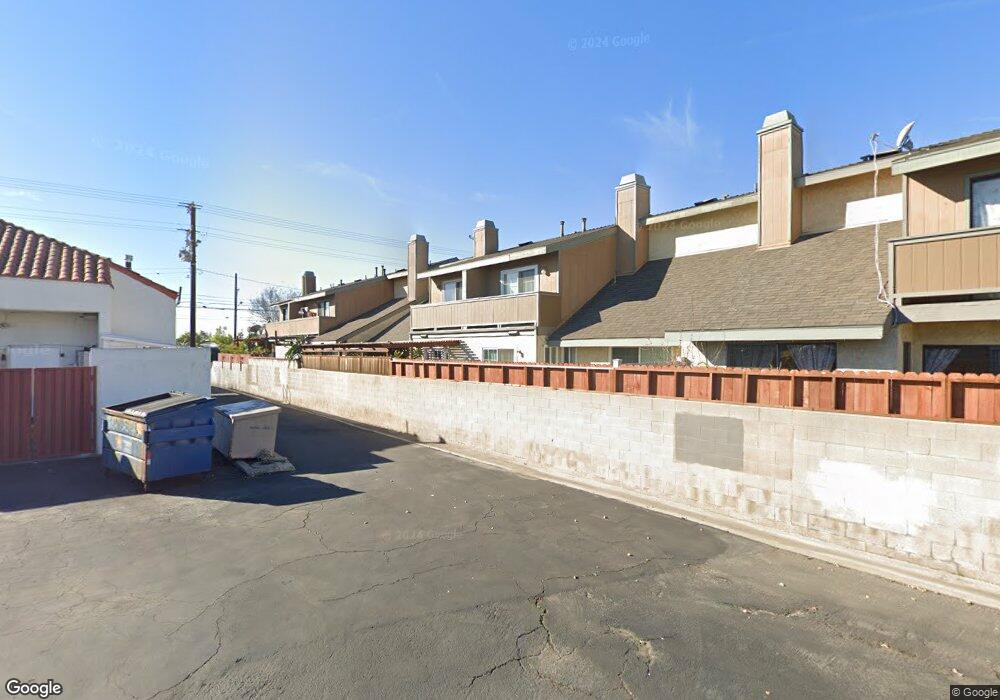
13962 Sandy Way Unit A29 Garden Grove, CA 92844
Estimated Value: $683,000 - $774,000
3
Beds
2
Baths
1,412
Sq Ft
$514/Sq Ft
Est. Value
About This Home
This home is located at 13962 Sandy Way Unit A29, Garden Grove, CA 92844 and is currently estimated at $725,832, approximately $514 per square foot. 13962 Sandy Way Unit A29 is a home located in Orange County with nearby schools including Anderson Elementary School, Warner Middle, and Westminster High School.
Ownership History
Date
Name
Owned For
Owner Type
Purchase Details
Closed on
Jan 9, 2017
Sold by
Nguyen Helen
Bought by
Tran Le Tiffany
Current Estimated Value
Purchase Details
Closed on
Jun 28, 2001
Sold by
Tran Tiffany
Bought by
Nguyen Helen
Home Financials for this Owner
Home Financials are based on the most recent Mortgage that was taken out on this home.
Original Mortgage
$102,000
Interest Rate
7.24%
Purchase Details
Closed on
Feb 22, 2001
Sold by
Nguyen Helen and Tran Danny Huy
Bought by
Nguyen Helen and Tran Tiffany
Purchase Details
Closed on
Sep 21, 1999
Sold by
Thi Nguyen Manh and Thi Ngoc Tram
Bought by
Nguyen Helen and Tran Danny Huy
Purchase Details
Closed on
May 5, 1995
Sold by
Kijewski Edward and Kijewski Kay L
Bought by
Nguyen Manh Thi and Tran Tram Ngoc
Home Financials for this Owner
Home Financials are based on the most recent Mortgage that was taken out on this home.
Original Mortgage
$102,600
Interest Rate
7.92%
Create a Home Valuation Report for This Property
The Home Valuation Report is an in-depth analysis detailing your home's value as well as a comparison with similar homes in the area
Home Values in the Area
Average Home Value in this Area
Purchase History
| Date | Buyer | Sale Price | Title Company |
|---|---|---|---|
| Tran Le Tiffany | -- | None Available | |
| Nguyen Helen | -- | Southland Title | |
| Nguyen Helen | -- | Southland Title Corporation | |
| Nguyen Helen | -- | -- | |
| Nguyen Manh Thi | $114,000 | Southland Title Corp |
Source: Public Records
Mortgage History
| Date | Status | Borrower | Loan Amount |
|---|---|---|---|
| Previous Owner | Nguyen Helen | $102,000 | |
| Previous Owner | Nguyen Manh Thi | $102,600 |
Source: Public Records
Tax History Compared to Growth
Tax History
| Year | Tax Paid | Tax Assessment Tax Assessment Total Assessment is a certain percentage of the fair market value that is determined by local assessors to be the total taxable value of land and additions on the property. | Land | Improvement |
|---|---|---|---|---|
| 2025 | $3,178 | $236,287 | $87,918 | $148,369 |
| 2024 | $3,178 | $231,654 | $86,194 | $145,460 |
| 2023 | $3,074 | $227,112 | $84,504 | $142,608 |
| 2022 | $3,025 | $222,659 | $82,847 | $139,812 |
| 2021 | $2,963 | $218,294 | $81,223 | $137,071 |
| 2020 | $2,928 | $216,056 | $80,390 | $135,666 |
| 2019 | $2,896 | $211,820 | $78,814 | $133,006 |
| 2018 | $2,890 | $207,667 | $77,268 | $130,399 |
| 2017 | $2,704 | $203,596 | $75,753 | $127,843 |
| 2016 | $2,603 | $199,604 | $74,267 | $125,337 |
| 2015 | $2,557 | $196,606 | $73,151 | $123,455 |
| 2014 | $2,499 | $192,755 | $71,718 | $121,037 |
Source: Public Records
Map
Nearby Homes
- 8784 Hewitt Place Unit 12
- 13839 Magnolia St
- 8866 Grandville Cir
- 8741 Jennrich Ave
- 13782 Newland St
- 9200 Westminster Blvd Unit 25
- 14431 Nola St
- 14342 Tilden St
- 8442 Trask Ave
- 13411 Magnolia St
- 13392 Lucille St
- 13392 Magnolia St
- 8192 18th St
- 8202 19th St
- 14572 Purdy St
- 8181 20th St
- 9132 Hazard Ave
- 9031 Bestel Ave
- 8565 Edgebrook Dr
- 9002 Imperial Ave
- 13959 Sandy Way Unit 22d
- 13965 Lindy Way Unit 1A
- 8793 Saint John Dr Unit 7B
- 8788 Saint John Dr Unit 15D
- 8794 Saint John Dr Unit D17
- 8792 Saint John Dr Unit 16C
- 13959 Sandy Way Unit D22
- 8807 Saint John Dr Unit B
- 13955 Lindy Way Unit 3B
- 13945 Lindy Way Unit 5A
- 8811 Saint John Dr Unit 11B
- 8797 Saint John Dr Unit 8B
- 8782 Saint John Dr Unit 13D
- 13965 Lindy Way Unit 1A
- 8793 Saint John Dr
- 13956 Sandy Way Unit 288
- 13939 Lindy Way Unit A6
- 13946 Sandy Way Unit 26A
- 8778 Saint John Dr
- 13956 Lindy Way Unit 19D