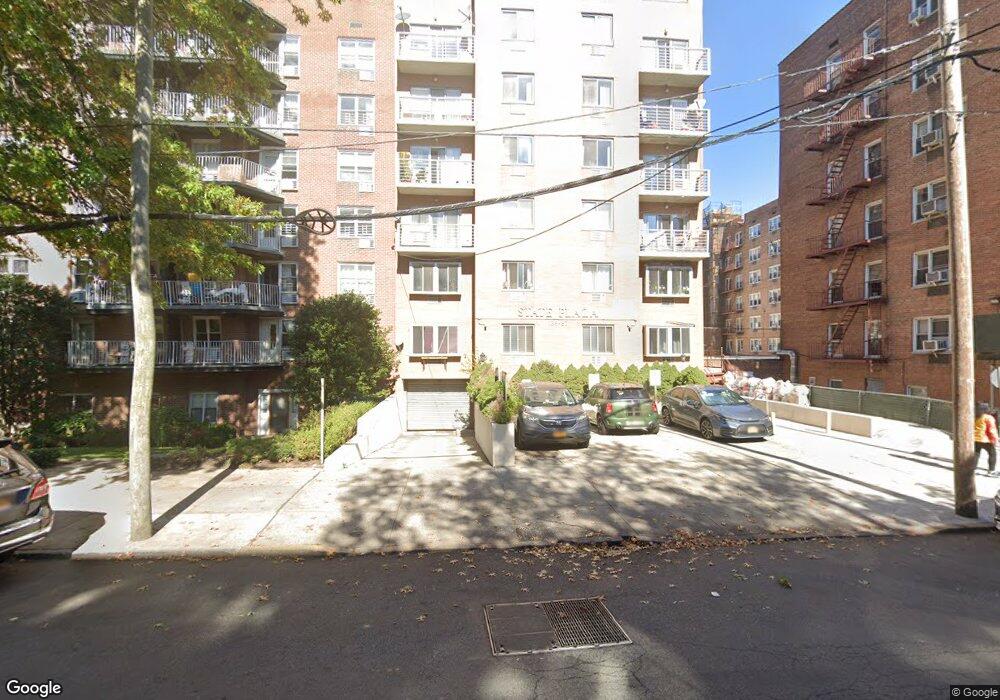
13987 35th Ave Unit 3B Flushing, NY 11354
Flushing NeighborhoodEstimated Value: $411,427 - $657,000
--
Bed
--
Bath
911
Sq Ft
$578/Sq Ft
Est. Value
About This Home
This home is located at 13987 35th Ave Unit 3B, Flushing, NY 11354 and is currently estimated at $526,607, approximately $578 per square foot. 13987 35th Ave Unit 3B is a home located in Queens County with nearby schools including P.S. 21 Edward Hart, Flushing High School, and Flushing Christian School.
Ownership History
Date
Name
Owned For
Owner Type
Purchase Details
Closed on
Aug 3, 2023
Sold by
Ma Kung Nam and Ma Vincent
Bought by
Zhou Xiu Fang and Zhou Xiu Mei
Current Estimated Value
Home Financials for this Owner
Home Financials are based on the most recent Mortgage that was taken out on this home.
Original Mortgage
$400,000
Outstanding Balance
$389,840
Interest Rate
6.67%
Mortgage Type
Purchase Money Mortgage
Estimated Equity
$136,767
Purchase Details
Closed on
Jul 13, 2003
Sold by
Mar Kung Nam
Bought by
Ma Vincent and Mar Kung Nam
Purchase Details
Closed on
Nov 5, 1999
Sold by
State Street 35Th Ave Realty Inc
Bought by
Mar King Nam
Home Financials for this Owner
Home Financials are based on the most recent Mortgage that was taken out on this home.
Original Mortgage
$52,000
Interest Rate
7.35%
Mortgage Type
Purchase Money Mortgage
Create a Home Valuation Report for This Property
The Home Valuation Report is an in-depth analysis detailing your home's value as well as a comparison with similar homes in the area
Home Values in the Area
Average Home Value in this Area
Purchase History
| Date | Buyer | Sale Price | Title Company |
|---|---|---|---|
| Zhou Xiu Fang | $660,000 | -- | |
| Zhou Xiu Fang | $660,000 | -- | |
| Zhou Xiu Fang | $660,000 | -- | |
| Ma Vincent | -- | -- | |
| Ma Vincent | -- | -- | |
| Mar King Nam | $178,500 | -- | |
| Mar King Nam | $178,500 | -- |
Source: Public Records
Mortgage History
| Date | Status | Borrower | Loan Amount |
|---|---|---|---|
| Open | Zhou Xiu Fang | $400,000 | |
| Closed | Zhou Xiu Fang | $400,000 | |
| Previous Owner | Mar King Nam | $52,000 |
Source: Public Records
Tax History Compared to Growth
Tax History
| Year | Tax Paid | Tax Assessment Tax Assessment Total Assessment is a certain percentage of the fair market value that is determined by local assessors to be the total taxable value of land and additions on the property. | Land | Improvement |
|---|---|---|---|---|
| 2025 | $5,170 | $43,338 | $6,516 | $36,822 |
| 2024 | $5,950 | $41,352 | $6,250 | $35,102 |
| 2023 | $5,808 | $46,454 | $5,985 | $40,469 |
| 2022 | $2,502 | $47,512 | $6,516 | $40,996 |
| 2021 | $5,224 | $42,584 | $6,516 | $36,068 |
| 2020 | $5,349 | $48,786 | $5,189 | $43,597 |
| 2019 | $5,042 | $43,858 | $5,189 | $38,669 |
| 2018 | $4,830 | $37,972 | $5,007 | $32,965 |
| 2017 | $4,497 | $35,358 | $4,547 | $30,811 |
| 2016 | $4,294 | $35,358 | $4,547 | $30,811 |
| 2015 | $1,865 | $31,362 | $4,261 | $27,101 |
| 2014 | $1,865 | $30,574 | $4,443 | $26,131 |
Source: Public Records
Map
Nearby Homes
- 148-04/08 35th Ave
- 34-20 Parsons Blvd Unit 3
- 34-20 Parsons Blvd Unit 4
- 34-20 Parsons Blvd Unit 5
- 34-20 Parsons Blvd Unit 6F
- 34-20 Parsons Blvd Unit 6V
- 34-20 Parsons Blvd Unit LJ
- 139-76 35th Ave Unit 2B
- 139-76 35th Ave Unit 7F
- 33-38 Parsons Blvd Unit 5E
- 33-38 Parsons Blvd Unit 6G
- 140-55 34th Ave Unit 3B
- 140-55 34th Ave Unit 6
- 140-55 34th Ave Unit 3E
- 141-25 Northern Blvd Unit B21
- 141-25 Northern Blvd Unit B2
- 141-25 Northern Blvd Unit C4
- 140-40 34th Ave Unit 2A
- 14055 34th Ave Unit 6C
- 140-39 34th Ave Unit 2T
- 139-87 35th Ave Unit 6D
- 139-87 35th Ave Unit 3A
- 13987 35th Ave Unit CA
- 13987 35th Ave Unit 6D
- 13987 35th Ave Unit 6C
- 13987 35th Ave Unit 6B
- 13987 35th Ave Unit 6A
- 13987 35th Ave Unit 5C
- 13987 35th Ave Unit 5B
- 13987 35th Ave Unit 5A
- 13987 35th Ave Unit 4C
- 13987 35th Ave Unit 4B
- 13987 35th Ave Unit 4A
- 13987 35th Ave Unit 3C
- 13987 35th Ave Unit 3A
- 13987 35th Ave Unit 2C
- 13987 35th Ave Unit 2B
- 13987 35th Ave Unit 2A
- 13987 35th Ave Unit 1C
- 13987 35th Ave Unit 1B