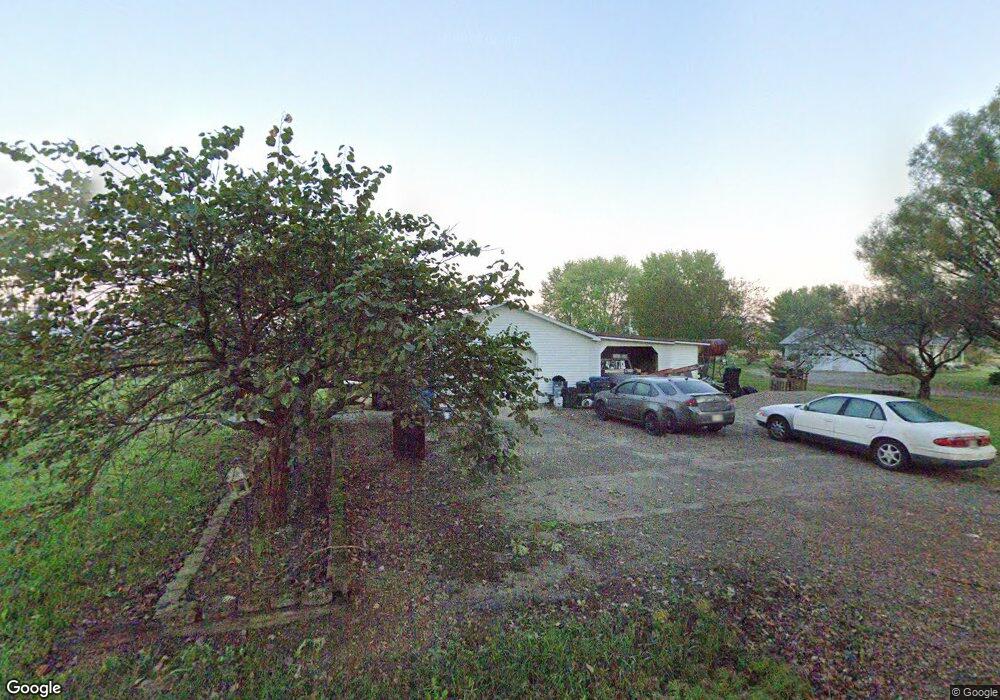
1399 Cedar Mills Rd Blue Creek, OH 45616
Estimated Value: $170,000 - $316,000
3
Beds
2
Baths
1,760
Sq Ft
$132/Sq Ft
Est. Value
About This Home
This home is located at 1399 Cedar Mills Rd, Blue Creek, OH 45616 and is currently estimated at $232,189, approximately $131 per square foot. 1399 Cedar Mills Rd is a home located in Adams County with nearby schools including West Union Elementary School and West Union High School.
Ownership History
Date
Name
Owned For
Owner Type
Purchase Details
Closed on
Nov 21, 2025
Sold by
Hall Katherine Lois and Hall Kathy
Bought by
Craig Derek G and Craig Whitney V
Current Estimated Value
Purchase Details
Closed on
Nov 14, 2025
Sold by
Hall Kathy L
Bought by
Frost Samantha W
Purchase Details
Closed on
Nov 17, 2023
Sold by
Bennett Douglas L
Bought by
Bennett Douglas L and Bennett Jason
Purchase Details
Closed on
Apr 20, 2005
Sold by
Bennett James Harold
Bought by
Hall Dean C and Hall Kathy L
Home Financials for this Owner
Home Financials are based on the most recent Mortgage that was taken out on this home.
Original Mortgage
$47,635
Interest Rate
6.19%
Mortgage Type
Purchase Money Mortgage
Purchase Details
Closed on
Mar 4, 2002
Bought by
Hall Dean C
Create a Home Valuation Report for This Property
The Home Valuation Report is an in-depth analysis detailing your home's value as well as a comparison with similar homes in the area
Home Values in the Area
Average Home Value in this Area
Purchase History
| Date | Buyer | Sale Price | Title Company |
|---|---|---|---|
| Craig Derek G | $36,377 | None Listed On Document | |
| Frost Samantha W | $18,075 | None Listed On Document | |
| Bennett Douglas L | -- | None Listed On Document | |
| Bennett Douglas L | -- | None Listed On Document | |
| Hall Dean C | $34,350 | None Available | |
| Hall Dean C | -- | -- |
Source: Public Records
Mortgage History
| Date | Status | Borrower | Loan Amount |
|---|---|---|---|
| Previous Owner | Hall Dean C | $47,635 |
Source: Public Records
Tax History Compared to Growth
Tax History
| Year | Tax Paid | Tax Assessment Tax Assessment Total Assessment is a certain percentage of the fair market value that is determined by local assessors to be the total taxable value of land and additions on the property. | Land | Improvement |
|---|---|---|---|---|
| 2024 | $1,349 | $54,570 | $10,260 | $44,310 |
| 2023 | $1,314 | $54,570 | $10,260 | $44,310 |
| 2022 | $1,318 | $48,650 | $7,070 | $41,580 |
| 2021 | $1,288 | $48,650 | $7,070 | $41,580 |
| 2020 | $1,317 | $48,650 | $7,070 | $41,580 |
| 2019 | $1,317 | $48,650 | $7,070 | $41,580 |
| 2018 | $1,034 | $41,720 | $7,070 | $34,650 |
| 2017 | $1,016 | $41,720 | $7,070 | $34,650 |
| 2016 | $1,015 | $41,720 | $7,070 | $34,650 |
| 2015 | $993 | $40,710 | $5,180 | $35,530 |
| 2014 | $950 | $39,550 | $5,180 | $34,370 |
Source: Public Records
Map
Nearby Homes
- 2030 Cedar Mills Rd
- 2316 White Oak Rd
- 2314 White Oak Rd
- 0 Coon Hollow Rd Unit 947967
- 2991 Cedar Mills Rd
- acres Coon Hollow Rd
- 9 Coon Hollow Rd
- 5740 St Rt 781
- 7851 Ohio 348
- 1286 Steam Furnace Rd
- 2603 Cassel Run Rd
- 1064 Hafer Rd
- 668 Fawcett Rd
- 1011 Hafer Rd
- 0 St Rt 348 Unit 1855893
- 0 Paradise Valley Rd Unit 1852764
- 19004 State Route 41
- 12808 Ohio 348
- 858 Randalls Run Rd
- 598 Ohio 348
- 1535 Cedar Mills Rd
- 1573 Cedar Mills Rd
- 1340 Cedar Mills Rd
- 1626 Cedar Mills Rd
- 1151 Cedar Mills Rd
- 1601 Cedar Mills Rd
- 1734 Cedar Mills Rd
- 1737 Cedar Mills Rd
- 383 Courtney Rd
- 93 Cole Rd
- 125 Cole Rd
- 23 Cole Rd
- 394 Cole Rd
- 171 Cole Rd
- 585 Cole Rd
- 1830 Cedar Mills Rd
- 1900 Cedar Mills Rd
- 860 Cedar Mills Rd
- 1887 Cedar Mills Rd
- 576 Courtney Rd