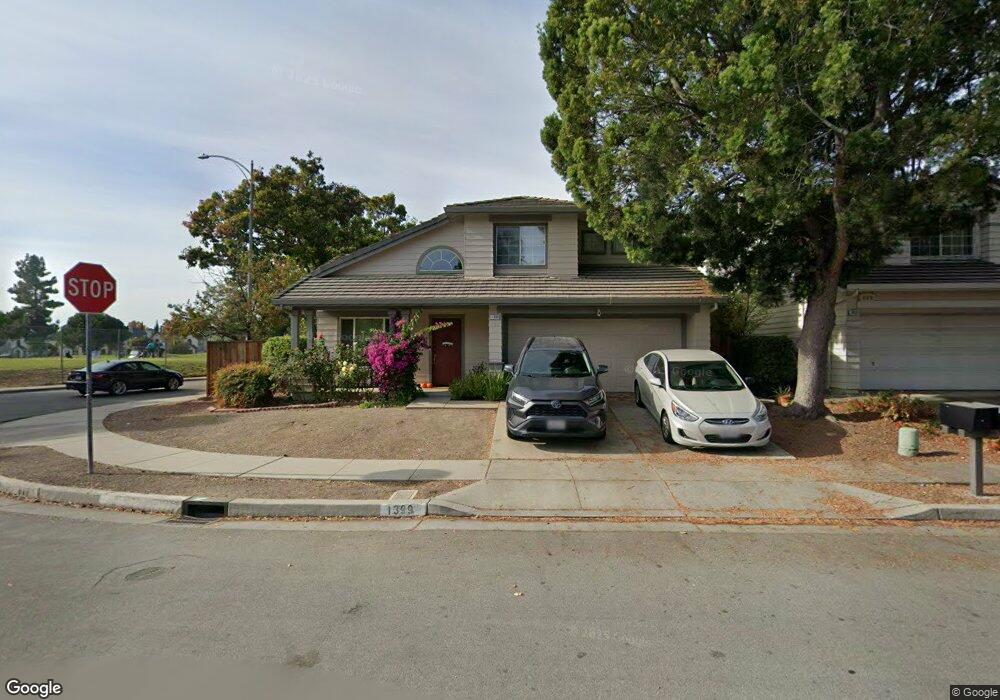
1399 Chavez Way San Jose, CA 95131
Carmine-Parkmont NeighborhoodEstimated Value: $1,550,789 - $1,853,000
4
Beds
3
Baths
1,797
Sq Ft
$962/Sq Ft
Est. Value
About This Home
This home is located at 1399 Chavez Way, San Jose, CA 95131 and is currently estimated at $1,729,197, approximately $962 per square foot. 1399 Chavez Way is a home located in Santa Clara County with nearby schools including Brooktree Elementary School, Morrill Middle School, and Independence High School.
Ownership History
Date
Name
Owned For
Owner Type
Purchase Details
Closed on
May 15, 2025
Sold by
Li Qiang and Liu Yu
Bought by
Li Family Trust and Li
Current Estimated Value
Purchase Details
Closed on
Apr 7, 1998
Sold by
Prabir Mohanty
Bought by
Li Qiang and Liu Yu
Home Financials for this Owner
Home Financials are based on the most recent Mortgage that was taken out on this home.
Original Mortgage
$298,000
Interest Rate
7.62%
Purchase Details
Closed on
Mar 1, 1994
Sold by
Huang Yuh Long and Shim Siu Lin
Bought by
Mohanty Prabir and Mohanty Madhusmita
Home Financials for this Owner
Home Financials are based on the most recent Mortgage that was taken out on this home.
Original Mortgage
$228,000
Interest Rate
7%
Create a Home Valuation Report for This Property
The Home Valuation Report is an in-depth analysis detailing your home's value as well as a comparison with similar homes in the area
Home Values in the Area
Average Home Value in this Area
Purchase History
| Date | Buyer | Sale Price | Title Company |
|---|---|---|---|
| Li Family Trust | -- | None Listed On Document | |
| Li Qiang | $372,500 | All Cal Title Company | |
| Mohanty Prabir | $285,000 | American Title Insurance Co |
Source: Public Records
Mortgage History
| Date | Status | Borrower | Loan Amount |
|---|---|---|---|
| Previous Owner | Li Qiang | $298,000 | |
| Previous Owner | Mohanty Prabir | $228,000 | |
| Closed | Li Qiang | $37,200 |
Source: Public Records
Tax History Compared to Growth
Tax History
| Year | Tax Paid | Tax Assessment Tax Assessment Total Assessment is a certain percentage of the fair market value that is determined by local assessors to be the total taxable value of land and additions on the property. | Land | Improvement |
|---|---|---|---|---|
| 2025 | $9,548 | $594,770 | $239,503 | $355,267 |
| 2024 | $9,548 | $583,108 | $234,807 | $348,301 |
| 2023 | $9,354 | $571,675 | $230,203 | $341,472 |
| 2022 | $8,700 | $560,467 | $225,690 | $334,777 |
| 2021 | $8,410 | $549,478 | $221,265 | $328,213 |
| 2020 | $8,144 | $543,845 | $218,997 | $324,848 |
| 2019 | $7,834 | $533,182 | $214,703 | $318,479 |
| 2018 | $7,719 | $522,729 | $210,494 | $312,235 |
| 2017 | $7,759 | $512,480 | $206,367 | $306,113 |
| 2016 | $7,437 | $502,432 | $202,321 | $300,111 |
| 2015 | $7,349 | $494,886 | $199,282 | $295,604 |
| 2014 | $6,695 | $485,193 | $195,379 | $289,814 |
Source: Public Records
Map
Nearby Homes
- 1441 Rocklin Ct Unit 112
- 0 Lundy Ave
- 1767 Clove Ct
- 1337 Araujo St
- 314 Morning Star Dr Unit 38
- 324 Morning Star Dr Unit 43
- 1210 Briarcreek Ct
- 1087 Bigleaf Place Unit 105
- 1087 Bigleaf Place Unit 108
- 1788 Camino Leonor
- 1233 Briarleaf Cir
- 1068 Bigleaf Place Unit 402
- 1287 Marcello Dr
- 900 Golden Wheel Park Dr Unit 28
- 900 Golden Wheel Park Dr Unit 29
- 900 Golden Wheel Park Dr Unit 66
- 900 Golden Wheel Unit 67
- 1057 Foxglove Place Unit 202
- 1809 Sageland Dr
- 1437 Marcello Dr
- 1403 Chavez Way
- 1320 Tanaka Dr
- 1407 Chavez Way
- 1336 Tanaka Dr
- 1506 Townsend Ave
- 1505 Chavez Ct
- 1411 Chavez Way
- 1344 Tanaka Dr
- 1497 Chavez Ct
- 1498 Townsend Ave
- 1415 Chavez Way
- 1352 Tanaka Dr
- 1510 Townsend Ave
- 1490 Townsend Ave
- 1489 Chavez Ct
- 1337 Tanaka Dr
- 1419 Chavez Way
- 1416 Chavez Way
- 1360 Tanaka Dr
- 1512 Townsend Ave