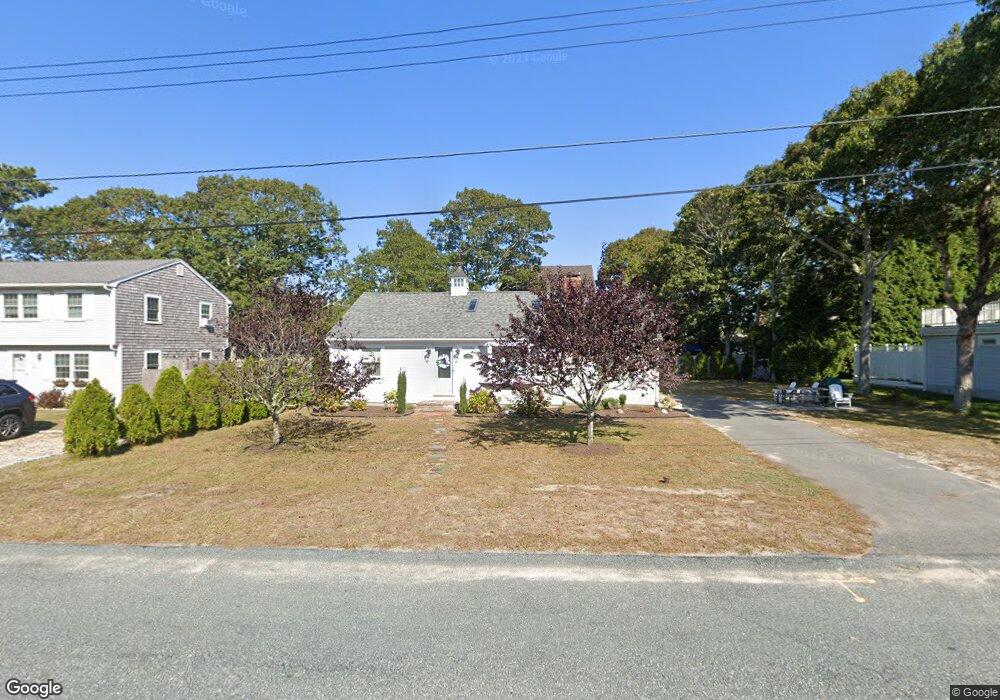
14 Aft Rd South Yarmouth, MA 02664
Estimated Value: $605,000 - $819,000
3
Beds
1
Bath
948
Sq Ft
$750/Sq Ft
Est. Value
About This Home
This home is located at 14 Aft Rd, South Yarmouth, MA 02664 and is currently estimated at $711,040, approximately $750 per square foot. 14 Aft Rd is a home located in Barnstable County with nearby schools including Dennis-Yarmouth Regional High School and St. Pius X. School.
Ownership History
Date
Name
Owned For
Owner Type
Purchase Details
Closed on
May 20, 2011
Sold by
Mainini Maria
Bought by
Adzigirey Stanislav and Adzigirey Liliya
Current Estimated Value
Purchase Details
Closed on
Dec 13, 2010
Sold by
Clinton Dorothy
Bought by
Mainini Maria
Home Financials for this Owner
Home Financials are based on the most recent Mortgage that was taken out on this home.
Original Mortgage
$180,000
Interest Rate
4.24%
Mortgage Type
Purchase Money Mortgage
Create a Home Valuation Report for This Property
The Home Valuation Report is an in-depth analysis detailing your home's value as well as a comparison with similar homes in the area
Home Values in the Area
Average Home Value in this Area
Purchase History
| Date | Buyer | Sale Price | Title Company |
|---|---|---|---|
| Adzigirey Stanislav | $255,000 | -- | |
| Mainini Maria | $180,000 | -- |
Source: Public Records
Mortgage History
| Date | Status | Borrower | Loan Amount |
|---|---|---|---|
| Previous Owner | Mainini Maria | $180,000 |
Source: Public Records
Tax History Compared to Growth
Tax History
| Year | Tax Paid | Tax Assessment Tax Assessment Total Assessment is a certain percentage of the fair market value that is determined by local assessors to be the total taxable value of land and additions on the property. | Land | Improvement |
|---|---|---|---|---|
| 2025 | $4,870 | $687,800 | $436,600 | $251,200 |
| 2024 | $4,504 | $610,300 | $379,700 | $230,600 |
| 2023 | $4,173 | $514,500 | $309,900 | $204,600 |
| 2022 | $4,047 | $440,800 | $278,400 | $162,400 |
| 2021 | $3,813 | $398,900 | $261,600 | $137,300 |
| 2020 | $3,304 | $330,400 | $208,200 | $122,200 |
| 2019 | $3,154 | $312,300 | $208,200 | $104,100 |
| 2018 | $3,107 | $301,900 | $197,800 | $104,100 |
| 2017 | $3,025 | $301,900 | $197,800 | $104,100 |
| 2016 | $3,013 | $301,900 | $197,800 | $104,100 |
| 2015 | $2,910 | $289,800 | $197,800 | $92,000 |
Source: Public Records
Map
Nearby Homes