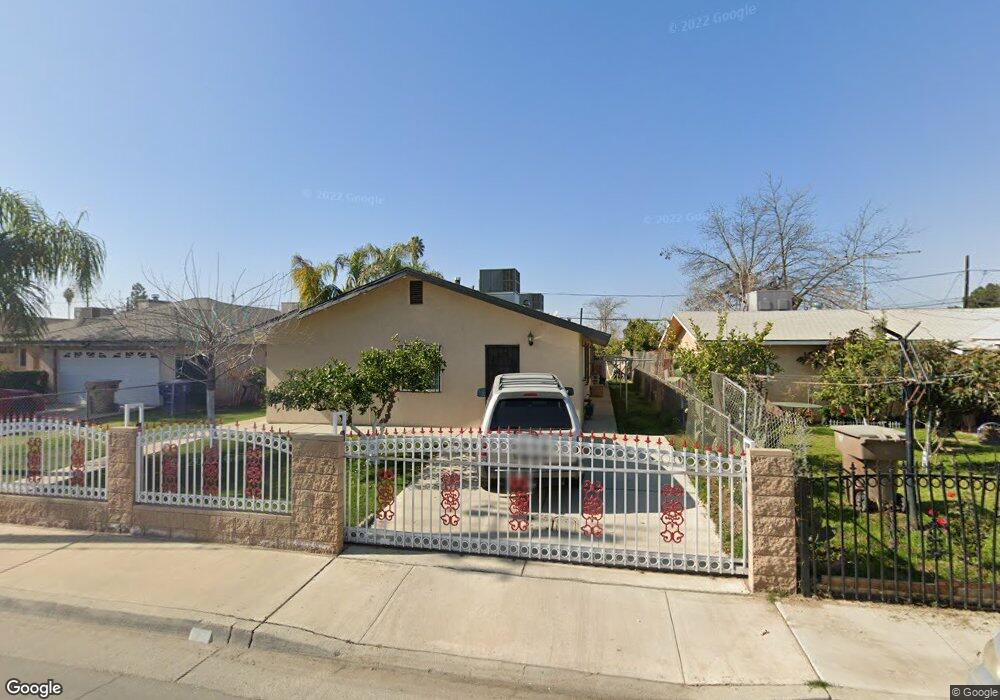
14 Augusta St Bakersfield, CA 93307
Lakeview NeighborhoodEstimated Value: $234,446 - $330,000
2
Beds
1
Bath
1,620
Sq Ft
$175/Sq Ft
Est. Value
About This Home
This home is located at 14 Augusta St, Bakersfield, CA 93307 and is currently estimated at $283,112, approximately $174 per square foot. 14 Augusta St is a home located in Kern County with nearby schools including Fremont Elementary School, Chipman Junior High School, and Mira Monte High School.
Ownership History
Date
Name
Owned For
Owner Type
Purchase Details
Closed on
Jun 18, 2003
Sold by
Bonilla Santiago C and Cruz Oscar A
Bought by
Bonilla Jose D
Current Estimated Value
Home Financials for this Owner
Home Financials are based on the most recent Mortgage that was taken out on this home.
Original Mortgage
$56,888
Outstanding Balance
$24,177
Interest Rate
5.37%
Mortgage Type
Purchase Money Mortgage
Estimated Equity
$258,935
Purchase Details
Closed on
Apr 30, 1996
Sold by
Bonilla Jose D
Bought by
Bonilla Santiago C
Home Financials for this Owner
Home Financials are based on the most recent Mortgage that was taken out on this home.
Original Mortgage
$56,953
Interest Rate
7.82%
Mortgage Type
FHA
Purchase Details
Closed on
Apr 2, 1996
Sold by
Randall Milford L and Randall Warnetta
Bought by
Bonilla Santiago C
Home Financials for this Owner
Home Financials are based on the most recent Mortgage that was taken out on this home.
Original Mortgage
$56,953
Interest Rate
7.82%
Mortgage Type
FHA
Purchase Details
Closed on
Feb 28, 1994
Sold by
Cisneros Henry G and Hud
Bought by
Henry Jimmy L
Home Financials for this Owner
Home Financials are based on the most recent Mortgage that was taken out on this home.
Original Mortgage
$26,700
Interest Rate
7%
Create a Home Valuation Report for This Property
The Home Valuation Report is an in-depth analysis detailing your home's value as well as a comparison with similar homes in the area
Home Values in the Area
Average Home Value in this Area
Purchase History
| Date | Buyer | Sale Price | Title Company |
|---|---|---|---|
| Bonilla Jose D | -- | Placer Title Company | |
| Bonilla Santiago C | -- | Fidelity National Title | |
| Bonilla Santiago C | $57,000 | Fidelity National Title Co | |
| Henry Jimmy L | $28,000 | Heritage Title Company |
Source: Public Records
Mortgage History
| Date | Status | Borrower | Loan Amount |
|---|---|---|---|
| Open | Bonilla Jose D | $56,888 | |
| Closed | Bonilla Santiago C | $56,953 | |
| Previous Owner | Henry Jimmy L | $26,700 |
Source: Public Records
Tax History Compared to Growth
Tax History
| Year | Tax Paid | Tax Assessment Tax Assessment Total Assessment is a certain percentage of the fair market value that is determined by local assessors to be the total taxable value of land and additions on the property. | Land | Improvement |
|---|---|---|---|---|
| 2025 | $2,235 | $93,727 | $9,851 | $83,876 |
| 2024 | $2,174 | $91,890 | $9,658 | $82,232 |
| 2023 | $2,174 | $90,089 | $9,469 | $80,620 |
| 2022 | $2,094 | $88,323 | $9,284 | $79,039 |
| 2021 | $1,910 | $86,593 | $9,103 | $77,490 |
| 2020 | $1,843 | $85,706 | $9,010 | $76,696 |
| 2019 | $1,806 | $85,706 | $9,010 | $76,696 |
| 2018 | $1,769 | $82,380 | $8,661 | $73,719 |
| 2017 | $1,752 | $80,766 | $8,492 | $72,274 |
| 2016 | $1,652 | $79,183 | $8,326 | $70,857 |
| 2015 | $1,632 | $77,995 | $8,201 | $69,794 |
| 2014 | $1,580 | $76,468 | $8,041 | $68,427 |
Source: Public Records
Map
Nearby Homes
- 11 Augusta St
- 30 S Owens St
- 108 Augusta St
- 100 S Owens St
- 145 Kincaid St
- 116 Tyree Toliver St
- 931 Texas St
- 301 Tyree Toliver St
- 126 Clyde St
- 1001 Padre St
- 301 Kincaid St
- 214 Madison St
- 301 Madison St
- 120 Clifton St
- 314 Augusta St
- 1012 Feliz Dr
- 101 Clifton St
- 103 Clifton St
- 921 Feliz Dr
- 200 Clifton St