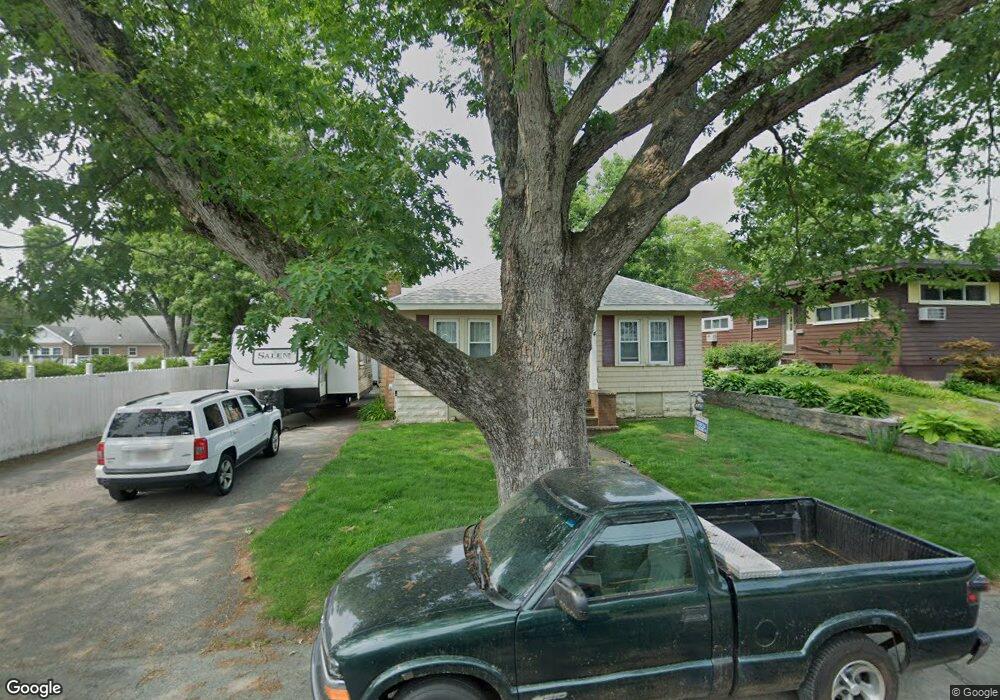
14 Birch Rd Brockton, MA 02302
Estimated Value: $413,000 - $532,000
3
Beds
1
Bath
1,234
Sq Ft
$372/Sq Ft
Est. Value
About This Home
This home is located at 14 Birch Rd, Brockton, MA 02302 and is currently estimated at $459,076, approximately $372 per square foot. 14 Birch Rd is a home located in Plymouth County with nearby schools including Gilmore Elementary School, Davis K-8 School, and John F. Kennedy Elementary School.
Ownership History
Date
Name
Owned For
Owner Type
Purchase Details
Closed on
Nov 10, 2016
Sold by
Gill Lauri L
Bought by
Gill John A
Current Estimated Value
Purchase Details
Closed on
Feb 14, 2012
Sold by
Gill John A
Bought by
Federal National Mortgage Association
Purchase Details
Closed on
Jan 15, 2002
Sold by
Jane M Macdonald T
Bought by
Gill John A and Gill John A
Create a Home Valuation Report for This Property
The Home Valuation Report is an in-depth analysis detailing your home's value as well as a comparison with similar homes in the area
Purchase History
| Date | Buyer | Sale Price | Title Company |
|---|---|---|---|
| Gill John A | -- | -- | |
| Federal National Mortgage Association | $6,436 | -- | |
| Gill John A | $162,000 | -- |
Source: Public Records
Mortgage History
| Date | Status | Borrower | Loan Amount |
|---|---|---|---|
| Previous Owner | Gill John A | $55,000 | |
| Previous Owner | Gill John A | $25,000 | |
| Previous Owner | Gill John A | $186,400 | |
| Previous Owner | Gill John A | $158,850 |
Source: Public Records
Tax History
| Year | Tax Paid | Tax Assessment Tax Assessment Total Assessment is a certain percentage of the fair market value that is determined by local assessors to be the total taxable value of land and additions on the property. | Land | Improvement |
|---|---|---|---|---|
| 2025 | $4,699 | $388,000 | $156,400 | $231,600 |
| 2024 | $4,614 | $383,900 | $156,400 | $227,500 |
| 2023 | $4,239 | $326,600 | $106,500 | $220,100 |
| 2022 | $4,412 | $315,800 | $96,800 | $219,000 |
| 2021 | $3,705 | $255,500 | $88,700 | $166,800 |
| 2020 | $3,841 | $253,500 | $78,300 | $175,200 |
| 2019 | $3,770 | $242,600 | $74,300 | $168,300 |
| 2018 | $5,004 | $207,200 | $74,300 | $132,900 |
| 2017 | $3,080 | $191,300 | $74,300 | $117,000 |
| 2016 | $3,295 | $189,800 | $70,900 | $118,900 |
| 2015 | $2,946 | $162,300 | $70,900 | $91,400 |
| 2014 | $2,886 | $159,200 | $70,900 | $88,300 |
Source: Public Records
Map
Nearby Homes
Your Personal Tour Guide
Ask me questions while you tour the home.