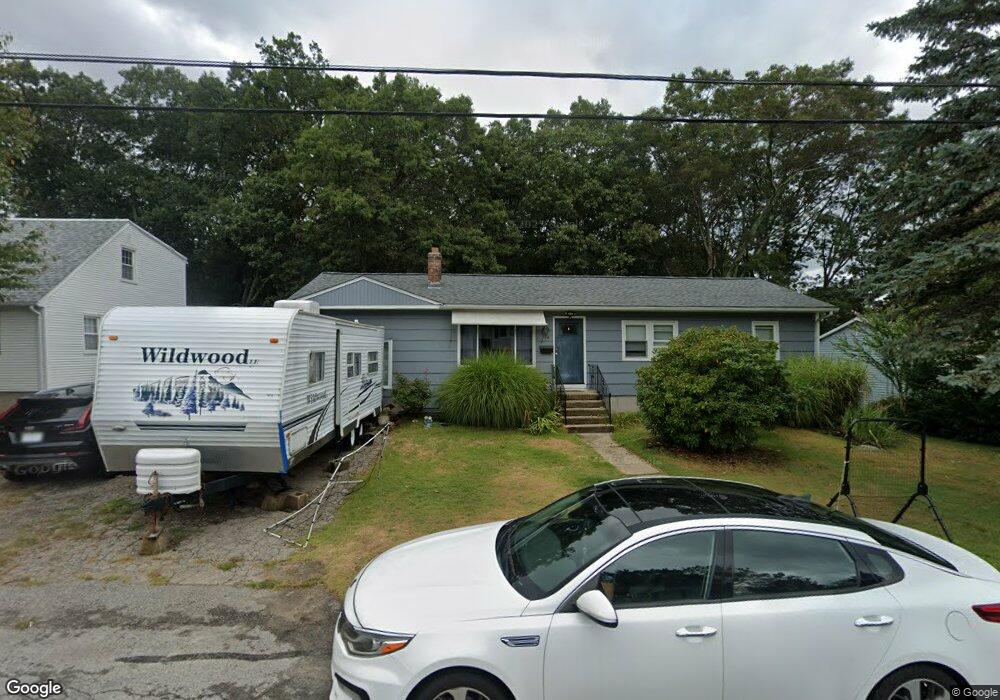
14 Boucher St West Warwick, RI 02893
Centreville NeighborhoodEstimated Value: $380,000 - $458,000
4
Beds
2
Baths
1,548
Sq Ft
$268/Sq Ft
Est. Value
About This Home
This home is located at 14 Boucher St, West Warwick, RI 02893 and is currently estimated at $414,841, approximately $267 per square foot. 14 Boucher St is a home located in Kent County with nearby schools including West Warwick High School.
Ownership History
Date
Name
Owned For
Owner Type
Purchase Details
Closed on
Feb 1, 2000
Sold by
Marcotte Maria
Bought by
Ruge Mark W and Ruge Katherine M
Current Estimated Value
Home Financials for this Owner
Home Financials are based on the most recent Mortgage that was taken out on this home.
Original Mortgage
$112,066
Outstanding Balance
$36,153
Interest Rate
7.83%
Estimated Equity
$378,688
Purchase Details
Closed on
Sep 9, 1996
Sold by
Geary Bruce C and Geary Rita
Bought by
Marcotte Maria
Home Financials for this Owner
Home Financials are based on the most recent Mortgage that was taken out on this home.
Original Mortgage
$82,400
Interest Rate
8.11%
Create a Home Valuation Report for This Property
The Home Valuation Report is an in-depth analysis detailing your home's value as well as a comparison with similar homes in the area
Home Values in the Area
Average Home Value in this Area
Purchase History
| Date | Buyer | Sale Price | Title Company |
|---|---|---|---|
| Ruge Mark W | $113,000 | -- | |
| Marcotte Maria | $103,000 | -- |
Source: Public Records
Mortgage History
| Date | Status | Borrower | Loan Amount |
|---|---|---|---|
| Open | Marcotte Maria | $112,066 | |
| Previous Owner | Marcotte Maria | $82,400 |
Source: Public Records
Tax History Compared to Growth
Tax History
| Year | Tax Paid | Tax Assessment Tax Assessment Total Assessment is a certain percentage of the fair market value that is determined by local assessors to be the total taxable value of land and additions on the property. | Land | Improvement |
|---|---|---|---|---|
| 2025 | $5,230 | $366,000 | $110,800 | $255,200 |
| 2024 | $5,175 | $276,900 | $74,200 | $202,700 |
| 2023 | $5,073 | $276,900 | $74,200 | $202,700 |
| 2022 | $4,995 | $276,900 | $74,200 | $202,700 |
| 2021 | $4,768 | $207,300 | $61,800 | $145,500 |
| 2020 | $4,768 | $207,300 | $61,800 | $145,500 |
| 2019 | $6,078 | $207,300 | $61,800 | $145,500 |
| 2018 | $4,392 | $161,600 | $64,300 | $97,300 |
| 2017 | $4,252 | $161,600 | $64,300 | $97,300 |
| 2016 | $4,176 | $161,600 | $64,300 | $97,300 |
| 2015 | $3,829 | $147,500 | $64,300 | $83,200 |
| 2014 | $3,745 | $147,500 | $64,300 | $83,200 |
Source: Public Records
Map
Nearby Homes
- 34 Buckley Ave
- 3 June Ct
- 170 Cowesett Ave
- 94 Cowesett Ave Unit 8
- 177 Cowesett Ave
- 25 School St
- 16 Ontario St
- 2 Teresa Ann Crossing
- 6 Teresa Ann Crossing
- 8 Teresa Ann Crossing
- 4 Teresa Ann Crossing
- 38 New London Ave
- 64 Lockwood St
- 33 Judy Terrace
- 45 Judy Terrace
- 46 Trellis Dr
- 52 Glen Dr
- 25 Fawn Ln
- 40 E Greenwich Ave
- 54 Arthur St