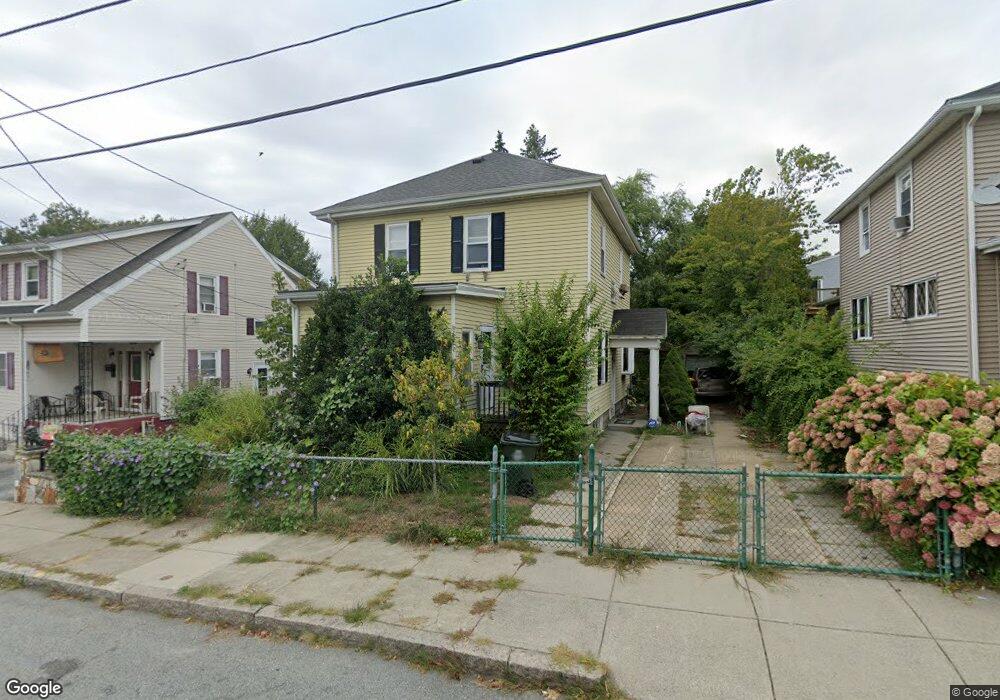
14 Bright St Fall River, MA 02721
Maplewood NeighborhoodEstimated Value: $382,000 - $407,000
3
Beds
2
Baths
1,636
Sq Ft
$242/Sq Ft
Est. Value
About This Home
This home is located at 14 Bright St, Fall River, MA 02721 and is currently estimated at $396,563, approximately $242 per square foot. 14 Bright St is a home located in Bristol County with nearby schools including Letourneau Elementary School, Matthew J. Kuss Middle School, and B M C Durfee High School.
Ownership History
Date
Name
Owned For
Owner Type
Purchase Details
Closed on
Dec 24, 2013
Sold by
Costa Jeannine M
Bought by
Costa Jeannine M and Bolger Liam S
Current Estimated Value
Create a Home Valuation Report for This Property
The Home Valuation Report is an in-depth analysis detailing your home's value as well as a comparison with similar homes in the area
Home Values in the Area
Average Home Value in this Area
Purchase History
| Date | Buyer | Sale Price | Title Company |
|---|---|---|---|
| Costa Jeannine M | -- | -- |
Source: Public Records
Tax History Compared to Growth
Tax History
| Year | Tax Paid | Tax Assessment Tax Assessment Total Assessment is a certain percentage of the fair market value that is determined by local assessors to be the total taxable value of land and additions on the property. | Land | Improvement |
|---|---|---|---|---|
| 2025 | $3,430 | $299,600 | $129,700 | $169,900 |
| 2024 | $3,234 | $281,500 | $124,800 | $156,700 |
| 2023 | $3,133 | $255,300 | $107,000 | $148,300 |
| 2022 | $2,712 | $220,900 | $97,200 | $123,700 |
| 2021 | $4,345 | $196,100 | $90,000 | $106,100 |
| 2020 | $4,284 | $185,300 | $86,100 | $99,200 |
| 2019 | $2,585 | $177,300 | $82,000 | $95,300 |
| 2018 | $4,154 | $172,200 | $80,500 | $91,700 |
| 2017 | $2,411 | $172,200 | $82,100 | $90,100 |
| 2016 | $2,321 | $170,300 | $85,500 | $84,800 |
| 2015 | $2,416 | $184,700 | $82,400 | $102,300 |
| 2014 | $2,378 | $189,000 | $86,700 | $102,300 |
Source: Public Records
Map
Nearby Homes
- 539 Aetna St
- 59 Wayne St
- 80 Lane St
- 478 Tucker St
- 323 S Oxford St
- 256 Rhode Island Ave
- 125 Carl St
- 306 Mott St
- 493 Peckham St
- 54 Grinnell St
- 215 Cambridge St
- 352 Vale St Unit 1
- 340 Vale St
- 59 Denver St
- 49 Stafford Rd
- 191 Glasgow St Unit 2
- 191 Glasgow St Unit 1
- 415 Anthony St
- 8 Gladding Place
- 76 Price Place