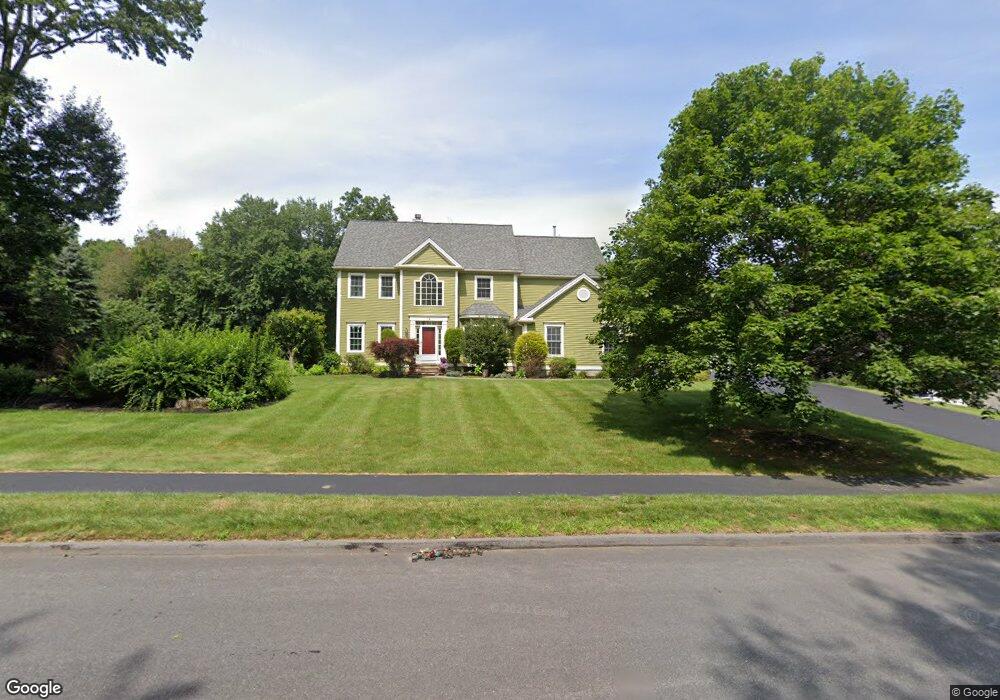
14 Castle Rd Northborough, MA 01532
Estimated Value: $1,081,685 - $1,318,000
4
Beds
3
Baths
2,984
Sq Ft
$389/Sq Ft
Est. Value
About This Home
This home is located at 14 Castle Rd, Northborough, MA 01532 and is currently estimated at $1,159,921, approximately $388 per square foot. 14 Castle Rd is a home located in Worcester County with nearby schools including Spring Street Elementary School, Sherwood Middle School, and Oak Middle School.
Ownership History
Date
Name
Owned For
Owner Type
Purchase Details
Closed on
Jul 20, 2006
Sold by
Wilkinson Kerry E and Wilkinson Melia A
Bought by
Moholkar Manoj and Moholkar Rohini
Current Estimated Value
Purchase Details
Closed on
Jul 31, 2001
Sold by
Jimenez David R and Jimenez Mary E
Bought by
Wilkinson Kerry E and Adams Melia
Purchase Details
Closed on
Apr 30, 1998
Sold by
Pulte Home Corp Mass
Bought by
Jiminez David R and Jiminez Mary E
Purchase Details
Closed on
Jun 27, 1995
Sold by
Northmeadow Dev Part
Bought by
Pulte Home Corp Mass
Create a Home Valuation Report for This Property
The Home Valuation Report is an in-depth analysis detailing your home's value as well as a comparison with similar homes in the area
Home Values in the Area
Average Home Value in this Area
Purchase History
| Date | Buyer | Sale Price | Title Company |
|---|---|---|---|
| Moholkar Manoj | $695,000 | -- | |
| Wilkinson Kerry E | $569,000 | -- | |
| Jiminez David R | $357,000 | -- | |
| Pulte Home Corp Mass | $75,000 | -- |
Source: Public Records
Mortgage History
| Date | Status | Borrower | Loan Amount |
|---|---|---|---|
| Open | Pulte Home Corp Mass | $301,000 | |
| Closed | Pulte Home Corp Mass | $403,000 |
Source: Public Records
Tax History
| Year | Tax Paid | Tax Assessment Tax Assessment Total Assessment is a certain percentage of the fair market value that is determined by local assessors to be the total taxable value of land and additions on the property. | Land | Improvement |
|---|---|---|---|---|
| 2025 | $15,210 | $1,067,400 | $362,000 | $705,400 |
| 2024 | $14,032 | $982,600 | $305,000 | $677,600 |
| 2023 | $13,225 | $894,200 | $288,200 | $606,000 |
| 2022 | $12,565 | $762,000 | $275,000 | $487,000 |
| 2021 | $846 | $710,000 | $251,000 | $459,000 |
| 2020 | $829 | $705,400 | $229,400 | $476,000 |
| 2019 | $11,900 | $693,900 | $229,400 | $464,500 |
| 2018 | $12,016 | $691,000 | $236,000 | $455,000 |
| 2017 | $11,710 | $673,400 | $236,000 | $437,400 |
| 2016 | $11,590 | $675,000 | $236,000 | $439,000 |
| 2015 | $10,665 | $637,500 | $261,100 | $376,400 |
| 2014 | $10,372 | $625,200 | $261,100 | $364,100 |
Source: Public Records
Map
Nearby Homes
- 7-11 Reservoir St
- 30 Bridle Path
- 9 Morningside Dr
- 81 West St
- 49 Barnard Hill Rd
- 50 Barnard Hill Rd
- 1A Mentzer Ave
- 8 Hunter Cir
- 15 Rocky Pond Rd
- 26 High St
- 63 High St
- 243 Spring St
- 105 Lincoln St
- 6 Lydias Way Unit 6
- 17 Wilder Rd
- 245 Brewer St
- 210 Green St
- 39 Pleasant St Unit A6
- 39 Pleasant St Unit C5
- 39 Pleasant St Unit A17
Your Personal Tour Guide
Ask me questions while you tour the home.