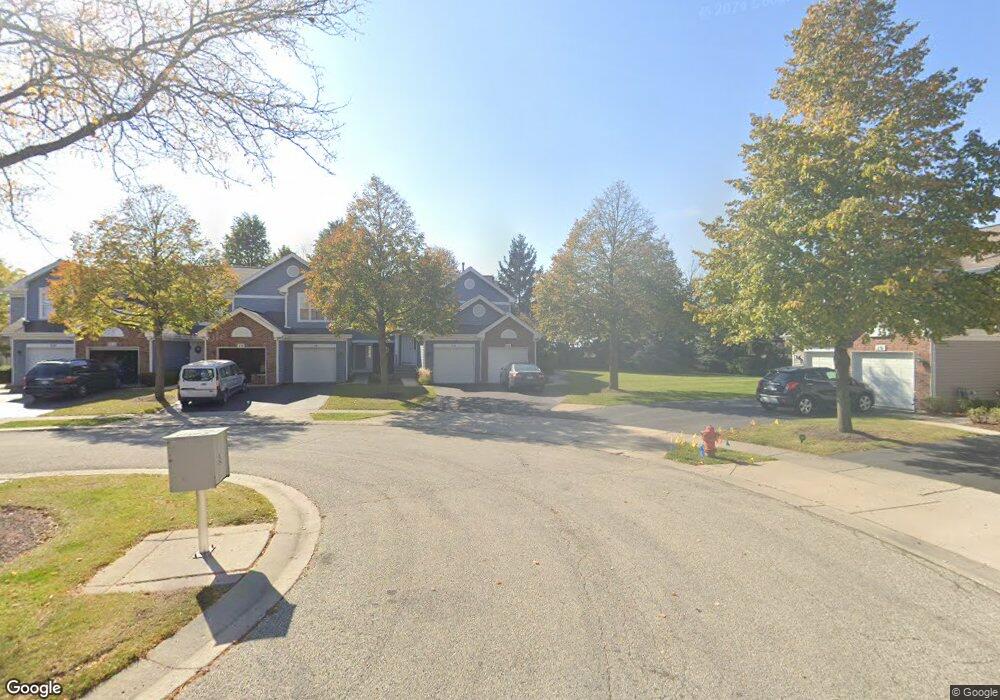
14 Cedar Grove Ct Unit 4316 Algonquin, IL 60102
Estimated Value: $216,511 - $250,000
2
Beds
--
Bath
1,026
Sq Ft
$225/Sq Ft
Est. Value
About This Home
This home is located at 14 Cedar Grove Ct Unit 4316, Algonquin, IL 60102 and is currently estimated at $230,878, approximately $225 per square foot. 14 Cedar Grove Ct Unit 4316 is a home located in Kane County with nearby schools including Westfield Community School and Harry D Jacobs High School.
Ownership History
Date
Name
Owned For
Owner Type
Purchase Details
Closed on
Sep 22, 2021
Sold by
Passananti Debra T
Bought by
Passananti Debra T and Passananti Debra T
Current Estimated Value
Purchase Details
Closed on
Nov 25, 2002
Sold by
Plogman Gwen F
Bought by
Passananti Debra T
Home Financials for this Owner
Home Financials are based on the most recent Mortgage that was taken out on this home.
Original Mortgage
$107,200
Outstanding Balance
$46,014
Interest Rate
6.23%
Estimated Equity
$184,864
Create a Home Valuation Report for This Property
The Home Valuation Report is an in-depth analysis detailing your home's value as well as a comparison with similar homes in the area
Home Values in the Area
Average Home Value in this Area
Purchase History
| Date | Buyer | Sale Price | Title Company |
|---|---|---|---|
| Passananti Debra T | -- | Attorney | |
| Passananti Debra T | $134,000 | Ticor Title Insurance Compan |
Source: Public Records
Mortgage History
| Date | Status | Borrower | Loan Amount |
|---|---|---|---|
| Open | Passananti Debra T | $107,200 |
Source: Public Records
Tax History Compared to Growth
Tax History
| Year | Tax Paid | Tax Assessment Tax Assessment Total Assessment is a certain percentage of the fair market value that is determined by local assessors to be the total taxable value of land and additions on the property. | Land | Improvement |
|---|---|---|---|---|
| 2024 | $2,382 | $59,059 | $8,371 | $50,688 |
| 2023 | $3,674 | $53,139 | $7,532 | $45,607 |
| 2022 | $3,454 | $47,327 | $7,532 | $39,795 |
| 2021 | $3,336 | $44,686 | $7,112 | $37,574 |
| 2020 | $3,264 | $43,681 | $6,952 | $36,729 |
| 2019 | $3,149 | $41,467 | $6,600 | $34,867 |
| 2018 | $2,824 | $36,628 | $6,469 | $30,159 |
| 2017 | $2,687 | $34,263 | $6,051 | $28,212 |
| 2016 | $2,744 | $33,175 | $5,859 | $27,316 |
| 2015 | -- | $25,831 | $5,490 | $20,341 |
| 2014 | -- | $25,117 | $5,338 | $19,779 |
| 2013 | -- | $28,338 | $5,501 | $22,837 |
Source: Public Records
Map
Nearby Homes
- 30 Arbordale Ct Unit 4284
- 1900 Waverly Ln
- 2101 Peach Tree Ln Unit 4094
- 1971 Peach Tree Ln
- 2043 Peach Tree Ln Unit 4122
- Marianne Plan at Algonquin Meadows - Traditional Townhomes
- Darcy Plan at Algonquin Meadows - Traditional Townhomes
- Charlotte Plan at Algonquin Meadows - Traditional Townhomes
- 000 County Line Rd
- Adams Plan at Algonquin Meadows - Single Family
- Sequoia Plan at Algonquin Meadows - Single Family
- Bryce Plan at Algonquin Meadows - Single Family
- Rainier Plan at Algonquin Meadows - Single Family
- Santa Rosa Plan at Algonquin Meadows - Single Family
- Biscayne Plan at Algonquin Meadows - Single Family
- Amherst Plan at Algonquin Meadows - Urban Townhomes
- Chatham Plan at Algonquin Meadows - Urban Townhomes
- Chelsea Plan at Algonquin Meadows - Urban Townhomes
- 2161 Burnham Ct
- 1090 Glenmont St
- 16 Cedar Grove Ct Unit 4315
- 24 Cedar Grove Ct Unit 4311
- 18 Cedar Grove Ct Unit 4314
- 20 Cedar Grove Ct Unit 4313
- 22 Cedar Grove Ct
- 2030 Waverly Ln
- 2036 Waverly Ln Unit 4321
- 2 Cedar Grove Ct
- 2034 Waverly Ln Unit 4382
- 6 Cedar Grove Ct Unit 4304
- 8 Cedar Grove Ct Unit 4303
- 10 Cedar Grove Ct Unit 4302
- 4 Cedar Grove Ct
- 12 Cedar Grove Ct
- 2027 Waverly Ln Unit 441
- 2029 Waverly Ln Unit 4412
- 2033 Waverly Ln Unit 4414
- 2009 Waverly Ln Unit 4424
- 2035 Waverly Ln Unit 4415
- 2035 Waverly Ln Unit 2035