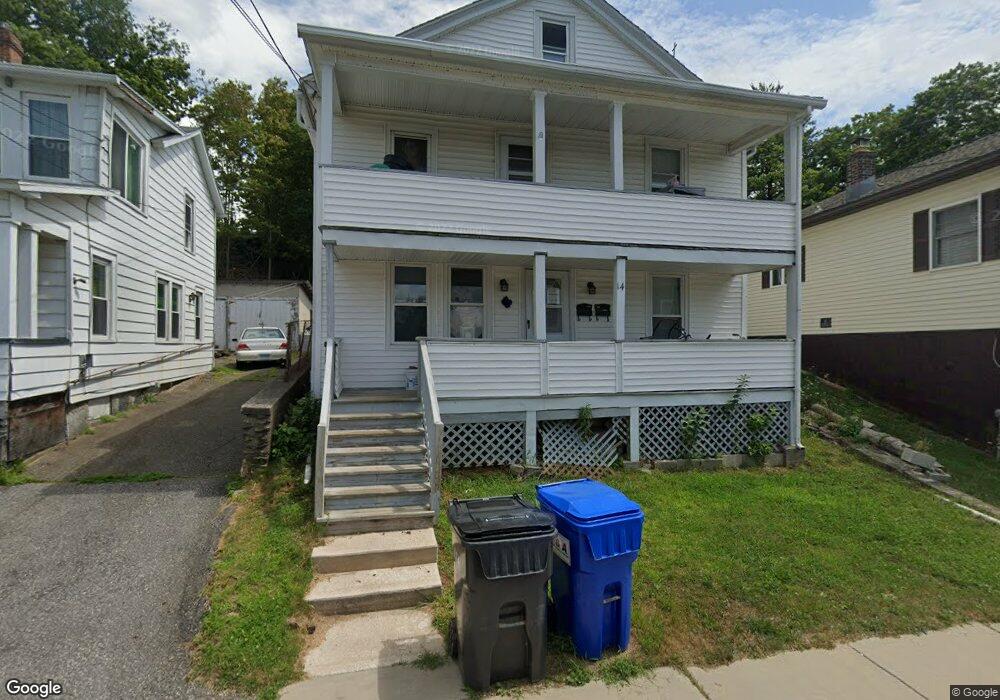
14 Chestnut St Unit 1 Winsted, CT 06098
Estimated Value: $168,000 - $234,000
2
Beds
1
Bath
800
Sq Ft
$248/Sq Ft
Est. Value
About This Home
This home is located at 14 Chestnut St Unit 1, Winsted, CT 06098 and is currently estimated at $198,538, approximately $248 per square foot. 14 Chestnut St Unit 1 is a home located in Litchfield County with nearby schools including Explorations Charter School, St Anthony School, and The Gilbert School.
Ownership History
Date
Name
Owned For
Owner Type
Purchase Details
Closed on
Jun 26, 2018
Sold by
Tkaczyk Mariusz
Bought by
Christie Cheri
Current Estimated Value
Home Financials for this Owner
Home Financials are based on the most recent Mortgage that was taken out on this home.
Original Mortgage
$83,460
Outstanding Balance
$74,029
Interest Rate
5.62%
Mortgage Type
FHA
Estimated Equity
$124,509
Purchase Details
Closed on
Jun 3, 2011
Sold by
Bac Home Loans Svcng L and Deutsche Bank Natl T C
Bought by
Tkaczyk Mariusz
Purchase Details
Closed on
Mar 31, 2004
Sold by
Ross James A and Ross David J
Bought by
Wolfson Adam and Sheinwald Daniel
Home Financials for this Owner
Home Financials are based on the most recent Mortgage that was taken out on this home.
Original Mortgage
$59,740
Interest Rate
5.56%
Create a Home Valuation Report for This Property
The Home Valuation Report is an in-depth analysis detailing your home's value as well as a comparison with similar homes in the area
Home Values in the Area
Average Home Value in this Area
Purchase History
| Date | Buyer | Sale Price | Title Company |
|---|---|---|---|
| Christie Cheri | $85,000 | -- | |
| Christie Cheri | $85,000 | -- | |
| Tkaczyk Mariusz | $20,500 | -- | |
| Tkaczyk Mariusz | $20,500 | -- | |
| Wolfson Adam | $65,000 | -- | |
| Wolfson Adam | $65,000 | -- |
Source: Public Records
Mortgage History
| Date | Status | Borrower | Loan Amount |
|---|---|---|---|
| Open | Christie Cheri | $83,460 | |
| Closed | Christie Cheri | $83,460 | |
| Previous Owner | Wolfson Adam | $23,600 | |
| Previous Owner | Wolfson Adam | $64,600 | |
| Previous Owner | Wolfson Adam | $59,740 |
Source: Public Records
Tax History Compared to Growth
Tax History
| Year | Tax Paid | Tax Assessment Tax Assessment Total Assessment is a certain percentage of the fair market value that is determined by local assessors to be the total taxable value of land and additions on the property. | Land | Improvement |
|---|---|---|---|---|
| 2025 | $2,391 | $81,970 | $12,180 | $69,790 |
| 2024 | $2,233 | $81,970 | $12,180 | $69,790 |
| 2023 | $2,163 | $81,970 | $12,180 | $69,790 |
| 2022 | $2,050 | $61,110 | $8,820 | $52,290 |
| 2021 | $4,189 | $61,110 | $8,820 | $52,290 |
| 2020 | $2,050 | $61,110 | $8,820 | $52,290 |
| 2019 | $3,978 | $61,110 | $8,820 | $52,290 |
| 2018 | $2,050 | $61,110 | $8,820 | $52,290 |
| 2017 | $3,941 | $62,020 | $8,820 | $53,200 |
| 2016 | $2,263 | $67,480 | $9,800 | $57,680 |
| 2015 | $2,207 | $67,480 | $9,800 | $57,680 |
| 2014 | $2,153 | $67,480 | $9,800 | $57,680 |
Source: Public Records
Map
Nearby Homes