Estimated Value: $462,000 - $492,000
3
Beds
2
Baths
1,182
Sq Ft
$405/Sq Ft
Est. Value
About This Home
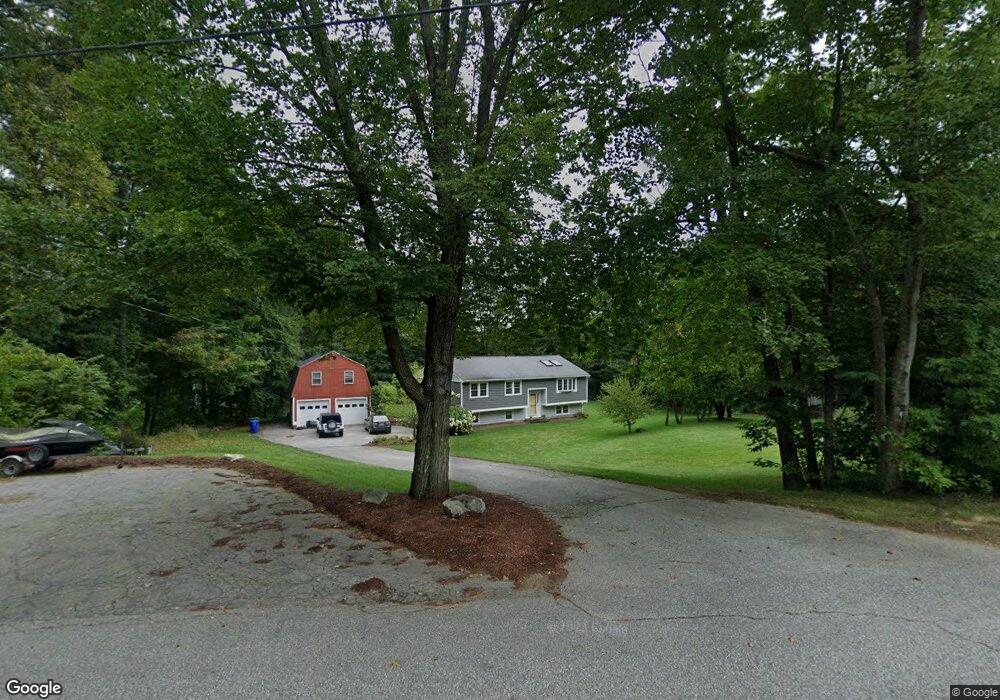
This home is located at 14 Clearview Dr, Bow, NH 03304 and is currently estimated at $479,079, approximately $405 per square foot. 14 Clearview Dr is a home with nearby schools including Bow Elementary School, Bow Memorial School, and Bow High School.
Ownership History
Date
Name
Owned For
Owner Type
Purchase Details
Closed on
Mar 13, 2023
Sold by
Barrington Mark A and Barrington Maureen E
Bought by
Barrington Mark A and Barrington Maureen E
Current Estimated Value
Home Financials for this Owner
Home Financials are based on the most recent Mortgage that was taken out on this home.
Original Mortgage
$100,000
Outstanding Balance
$92,075
Interest Rate
6.09%
Mortgage Type
Stand Alone Second
Estimated Equity
$387,004
Purchase Details
Closed on
Dec 11, 2018
Sold by
Barrington Mark A and Barrington Maureen E
Bought by
Barrington Mark A and Barrington Maureen E
Home Financials for this Owner
Home Financials are based on the most recent Mortgage that was taken out on this home.
Original Mortgage
$220,500
Interest Rate
4.9%
Mortgage Type
New Conventional
Create a Home Valuation Report for This Property
The Home Valuation Report is an in-depth analysis detailing your home's value as well as a comparison with similar homes in the area
Home Values in the Area
Average Home Value in this Area
Purchase History
| Date | Buyer | Sale Price | Title Company |
|---|---|---|---|
| Barrington Mark A | -- | None Available | |
| Barrington Mark A | -- | None Available | |
| Barrington Mark A | -- | -- | |
| Barrington Mark A | -- | -- | |
| Barrington Mark A | -- | -- |
Source: Public Records
Mortgage History
| Date | Status | Borrower | Loan Amount |
|---|---|---|---|
| Open | Barrington Mark A | $100,000 | |
| Closed | Barrington Mark A | $100,000 | |
| Previous Owner | Barrington Mark A | $220,500 |
Source: Public Records
Tax History
| Year | Tax Paid | Tax Assessment Tax Assessment Total Assessment is a certain percentage of the fair market value that is determined by local assessors to be the total taxable value of land and additions on the property. | Land | Improvement |
|---|---|---|---|---|
| 2024 | $8,658 | $437,700 | $138,300 | $299,400 |
| 2023 | $7,575 | $272,400 | $98,500 | $173,900 |
| 2022 | $7,224 | $272,400 | $98,500 | $173,900 |
| 2021 | $6,943 | $272,400 | $98,500 | $173,900 |
| 2020 | $6,968 | $272,400 | $98,500 | $173,900 |
| 2019 | $7,140 | $272,400 | $98,500 | $173,900 |
| 2018 | $6,734 | $242,400 | $89,800 | $152,600 |
| 2017 | $6,759 | $243,400 | $89,800 | $153,600 |
| 2016 | $6,399 | $243,400 | $89,800 | $153,600 |
| 2015 | $6,456 | $226,200 | $89,800 | $136,400 |
| 2014 | $6,675 | $226,200 | $89,800 | $136,400 |
| 2011 | $6,092 | $224,400 | $89,800 | $134,600 |
Source: Public Records
Map
Nearby Homes
- 36 Westover Ln Unit k
- 42 Westover Ln
- 13 Ferry Rd
- 22 Bow Bog Rd
- 29 Westover Ln
- 99 Bow Bog Rd
- 4 Bow Center Rd Unit F2
- 4 Bow Center Rd Unit B2
- 91 Whittemore Rd
- 20 Grandview Rd
- 481 Woodlawn Ridge Rd
- 7 Morgan Dr
- 214 Pembroke St
- 214 Pembroke St Unit A
- 77 White Rock Hill Rd
- 104 White Rock Hill Rd
- 107 Garvins Falls Rd
- 3 Abbey Rd
- 6 Abbey Rd
- 259 Pembroke St