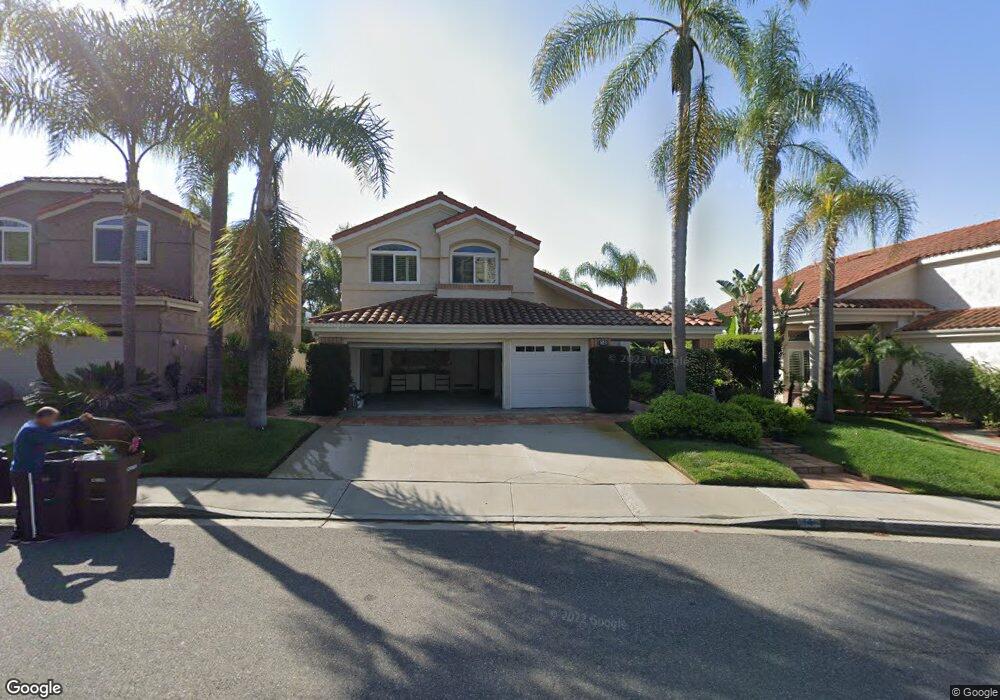
14 Corsica Laguna Niguel, CA 92677
Marina Hills NeighborhoodEstimated Value: $1,678,000 - $2,003,000
3
Beds
3
Baths
2,467
Sq Ft
$758/Sq Ft
Est. Value
About This Home
This home is located at 14 Corsica, Laguna Niguel, CA 92677 and is currently estimated at $1,870,093, approximately $758 per square foot. 14 Corsica is a home located in Orange County with nearby schools including Hidden Hills Elementary, Niguel Hills Middle School, and Dana Hills High School.
Ownership History
Date
Name
Owned For
Owner Type
Purchase Details
Closed on
Apr 5, 2023
Sold by
Ghetmiri Seyed Mohammad Ali and Ghetmiri Minoo
Bought by
Ghetmiri-Zeighami Living Trust
Current Estimated Value
Purchase Details
Closed on
Mar 10, 2011
Sold by
Baker John W and Baker Joanne K
Bought by
Ghetmiri Seyed M and Zeighani Minoo
Purchase Details
Closed on
Dec 10, 2009
Sold by
Baker Randy L
Bought by
Baker John W and Baker Joanne K
Purchase Details
Closed on
Apr 21, 2009
Sold by
Baker John W and Baker Joanne K
Bought by
Baker John W and Baker Joanne K
Home Financials for this Owner
Home Financials are based on the most recent Mortgage that was taken out on this home.
Original Mortgage
$375,000
Interest Rate
4.99%
Mortgage Type
New Conventional
Purchase Details
Closed on
Aug 2, 2005
Sold by
Baker John W and Baker Joanne K
Bought by
Baker John W and Baker Joanne K
Create a Home Valuation Report for This Property
The Home Valuation Report is an in-depth analysis detailing your home's value as well as a comparison with similar homes in the area
Home Values in the Area
Average Home Value in this Area
Purchase History
| Date | Buyer | Sale Price | Title Company |
|---|---|---|---|
| Ghetmiri-Zeighami Living Trust | -- | -- | |
| Ghetmiri Seyed M | $740,000 | Lawyers Title | |
| Baker John W | -- | None Available | |
| Baker John W | -- | Lsi | |
| Baker John W | -- | -- |
Source: Public Records
Mortgage History
| Date | Status | Borrower | Loan Amount |
|---|---|---|---|
| Previous Owner | Baker John W | $375,000 |
Source: Public Records
Tax History Compared to Growth
Tax History
| Year | Tax Paid | Tax Assessment Tax Assessment Total Assessment is a certain percentage of the fair market value that is determined by local assessors to be the total taxable value of land and additions on the property. | Land | Improvement |
|---|---|---|---|---|
| 2025 | $9,351 | $948,065 | $650,217 | $297,848 |
| 2024 | $9,351 | $929,476 | $637,468 | $292,008 |
| 2023 | $9,152 | $911,251 | $624,968 | $286,283 |
| 2022 | $8,976 | $893,384 | $612,714 | $280,670 |
| 2021 | $8,802 | $875,867 | $600,700 | $275,167 |
| 2020 | $8,714 | $866,887 | $594,541 | $272,346 |
| 2019 | $8,555 | $849,890 | $582,884 | $267,006 |
| 2018 | $8,446 | $833,226 | $571,455 | $261,771 |
| 2017 | $8,282 | $816,889 | $560,250 | $256,639 |
| 2016 | $8,123 | $800,872 | $549,265 | $251,607 |
| 2015 | $8,001 | $788,843 | $541,015 | $247,828 |
| 2014 | $7,848 | $773,391 | $530,417 | $242,974 |
Source: Public Records
Map
Nearby Homes