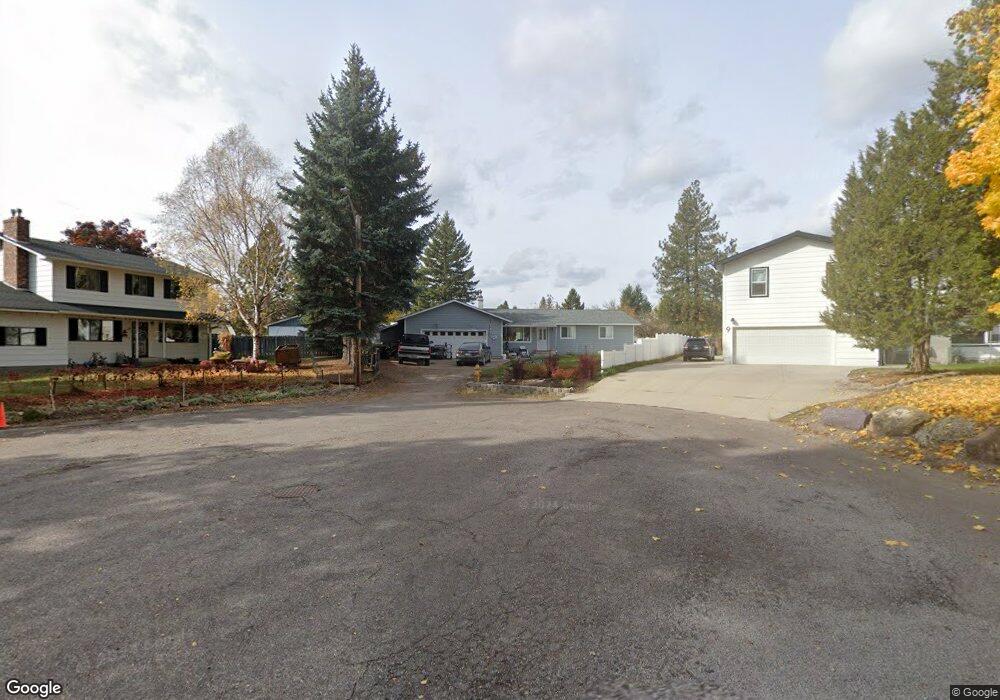
14 Crescent Cir Columbia Falls, MT 59912
Estimated Value: $411,000 - $490,000
3
Beds
2
Baths
1,424
Sq Ft
$316/Sq Ft
Est. Value
About This Home
This home is located at 14 Crescent Cir, Columbia Falls, MT 59912 and is currently estimated at $449,489, approximately $315 per square foot. 14 Crescent Cir is a home located in Flathead County with nearby schools including Glacier Gateway Elementary School, Columbia Falls Junior High School (7-8), and Columbia Falls High School.
Ownership History
Date
Name
Owned For
Owner Type
Purchase Details
Closed on
Sep 4, 2018
Sold by
Banning Byron D
Bought by
Banning Byron D and Banning Cassandra M
Current Estimated Value
Home Financials for this Owner
Home Financials are based on the most recent Mortgage that was taken out on this home.
Original Mortgage
$180,000
Outstanding Balance
$156,647
Interest Rate
4.5%
Mortgage Type
New Conventional
Estimated Equity
$292,842
Purchase Details
Closed on
Oct 2, 2015
Sold by
Thompson John D and Thompson Alison C
Bought by
Banning Byron D
Home Financials for this Owner
Home Financials are based on the most recent Mortgage that was taken out on this home.
Original Mortgage
$166,250
Interest Rate
4.25%
Mortgage Type
Adjustable Rate Mortgage/ARM
Purchase Details
Closed on
Aug 15, 2008
Sold by
Thompson John D and Thompson Alison C
Bought by
Thompson John D and Thompson Alison C
Home Financials for this Owner
Home Financials are based on the most recent Mortgage that was taken out on this home.
Original Mortgage
$100,000
Interest Rate
6.27%
Mortgage Type
New Conventional
Create a Home Valuation Report for This Property
The Home Valuation Report is an in-depth analysis detailing your home's value as well as a comparison with similar homes in the area
Home Values in the Area
Average Home Value in this Area
Purchase History
| Date | Buyer | Sale Price | Title Company |
|---|---|---|---|
| Banning Byron D | -- | First Title Montana | |
| Banning Byron D | -- | Fidelity National Title | |
| Thompson John D | -- | First American Title Company |
Source: Public Records
Mortgage History
| Date | Status | Borrower | Loan Amount |
|---|---|---|---|
| Open | Banning Byron D | $180,000 | |
| Closed | Banning Byron D | $166,250 | |
| Previous Owner | Thompson John D | $100,000 |
Source: Public Records
Tax History Compared to Growth
Tax History
| Year | Tax Paid | Tax Assessment Tax Assessment Total Assessment is a certain percentage of the fair market value that is determined by local assessors to be the total taxable value of land and additions on the property. | Land | Improvement |
|---|---|---|---|---|
| 2025 | $1,895 | $426,600 | $0 | $0 |
| 2024 | $2,461 | $349,400 | $0 | $0 |
| 2023 | $2,579 | $349,400 | $0 | $0 |
| 2022 | $2,546 | $241,000 | $0 | $0 |
| 2021 | $2,667 | $241,000 | $0 | $0 |
| 2020 | $2,396 | $201,700 | $0 | $0 |
| 2019 | $2,275 | $201,700 | $0 | $0 |
| 2018 | $2,087 | $176,600 | $0 | $0 |
| 2017 | $2,020 | $176,600 | $0 | $0 |
| 2016 | $2,013 | $173,200 | $0 | $0 |
| 2015 | $1,998 | $173,200 | $0 | $0 |
| 2014 | $1,845 | $95,824 | $0 | $0 |
Source: Public Records
Map
Nearby Homes
- 409 1st Street East N
- 943 Frontage Rd
- 307 5th St E
- 2225 Tamarack Ln
- 324 1st Ave E
- 221 2nd Ave W
- 519 Nucleus Ave Unit Suite 303
- 540 Nucleus Ave Unit 304
- 540 Nucleus Ave Unit 306
- 812 4th Ave E
- 1020 3rd Ave E
- 136 N Fork Trail
- 659 Us Highway 2 E
- 450 Highway 2 E
- 9 Cedar Pointe Loop
- 324 Bench Run
- 929 9th St W
- 378 River Rd Unit 5 parcels
- 23 Bench Run
- 830 11th St W
- 9 Crescent Cir
- 27 Council Bluffs Dr
- 23 Council Bluffs Dr
- 10 Crescent Cir
- 19 Council Bluffs Dr
- 88 Crescent Dr
- 51 Crescent Dr
- 15 Council Bluffs Dr
- 47 Crescent Dr
- Nhn Council Bluffs Dr
- 84 Crescent Dr
- 30 Council Bluffs Dr
- 26 Council Bluffs Dr
- 11 Council Bluffs Dr
- 43 Crescent Dr
- 46 Council Bluffs Dr
- 59 Crescent Dr
- 22 Council Bluffs Dr
- 34 Council Bluffs Dr
- 63 Crescent Dr