Estimated Value: $583,713 - $638,000
3
Beds
2
Baths
1,829
Sq Ft
$331/Sq Ft
Est. Value
About This Home
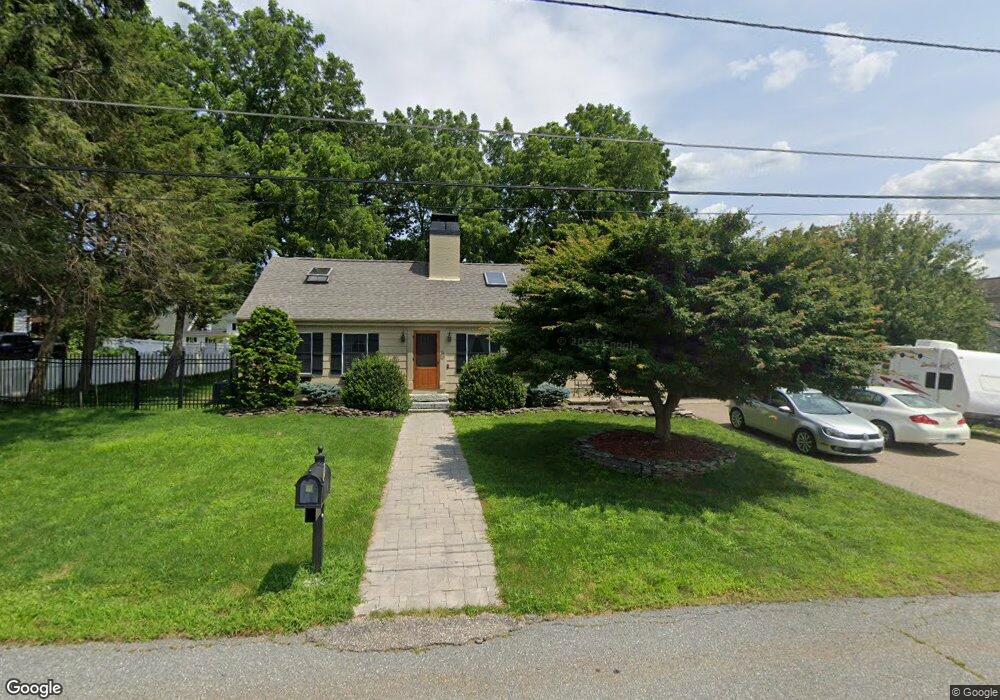
This home is located at 14 Darryl Ln, Salem, NH 03079 and is currently estimated at $605,928, approximately $331 per square foot. 14 Darryl Ln is a home located in Rockingham County with nearby schools including Mary A. Fisk Elementary School, Woodbury School, and Salem High School.
Ownership History
Date
Name
Owned For
Owner Type
Purchase Details
Closed on
Dec 16, 2016
Sold by
14 Darryl Lane Rt
Bought by
Jutras Robert A and Jutras Harrison R
Current Estimated Value
Purchase Details
Closed on
Sep 21, 2015
Sold by
Jutras Robert A
Bought by
14 Darryl Lane Rt and Jutras Robert A
Purchase Details
Closed on
Oct 7, 2003
Sold by
Gore James G and Gore Karen
Bought by
14 Darryl Lane Rt
Home Financials for this Owner
Home Financials are based on the most recent Mortgage that was taken out on this home.
Original Mortgage
$260,000
Interest Rate
6.25%
Mortgage Type
Purchase Money Mortgage
Purchase Details
Closed on
Jun 17, 1998
Sold by
Eidam Elizabeth A
Bought by
Gore James G and Gore Karen
Home Financials for this Owner
Home Financials are based on the most recent Mortgage that was taken out on this home.
Original Mortgage
$46,450
Interest Rate
7.09%
Mortgage Type
Purchase Money Mortgage
Create a Home Valuation Report for This Property
The Home Valuation Report is an in-depth analysis detailing your home's value as well as a comparison with similar homes in the area
Home Values in the Area
Average Home Value in this Area
Purchase History
| Date | Buyer | Sale Price | Title Company |
|---|---|---|---|
| Jutras Robert A | -- | -- | |
| 14 Darryl Lane Rt | -- | -- | |
| 14 Darryl Lane Rt | $315,000 | -- | |
| Gore James G | $48,900 | -- |
Source: Public Records
Mortgage History
| Date | Status | Borrower | Loan Amount |
|---|---|---|---|
| Previous Owner | Gore James G | $253,000 | |
| Previous Owner | Gore James G | $246,400 | |
| Previous Owner | Gore James G | $260,000 | |
| Previous Owner | Gore James G | $46,450 |
Source: Public Records
Tax History Compared to Growth
Tax History
| Year | Tax Paid | Tax Assessment Tax Assessment Total Assessment is a certain percentage of the fair market value that is determined by local assessors to be the total taxable value of land and additions on the property. | Land | Improvement |
|---|---|---|---|---|
| 2024 | $7,614 | $432,600 | $161,000 | $271,600 |
| 2023 | $7,337 | $432,600 | $161,000 | $271,600 |
| 2022 | $6,943 | $432,600 | $161,000 | $271,600 |
| 2021 | $6,913 | $432,600 | $161,000 | $271,600 |
| 2020 | $6,258 | $284,200 | $115,000 | $169,200 |
| 2019 | $6,247 | $284,200 | $115,000 | $169,200 |
| 2018 | $6,142 | $284,200 | $115,000 | $169,200 |
| 2017 | $5,923 | $284,200 | $115,000 | $169,200 |
| 2016 | $5,806 | $284,200 | $115,000 | $169,200 |
| 2015 | $5,253 | $245,600 | $117,900 | $127,700 |
| 2014 | $5,106 | $245,600 | $117,900 | $127,700 |
| 2013 | $5,025 | $245,600 | $117,900 | $127,700 |
Source: Public Records
Map
Nearby Homes