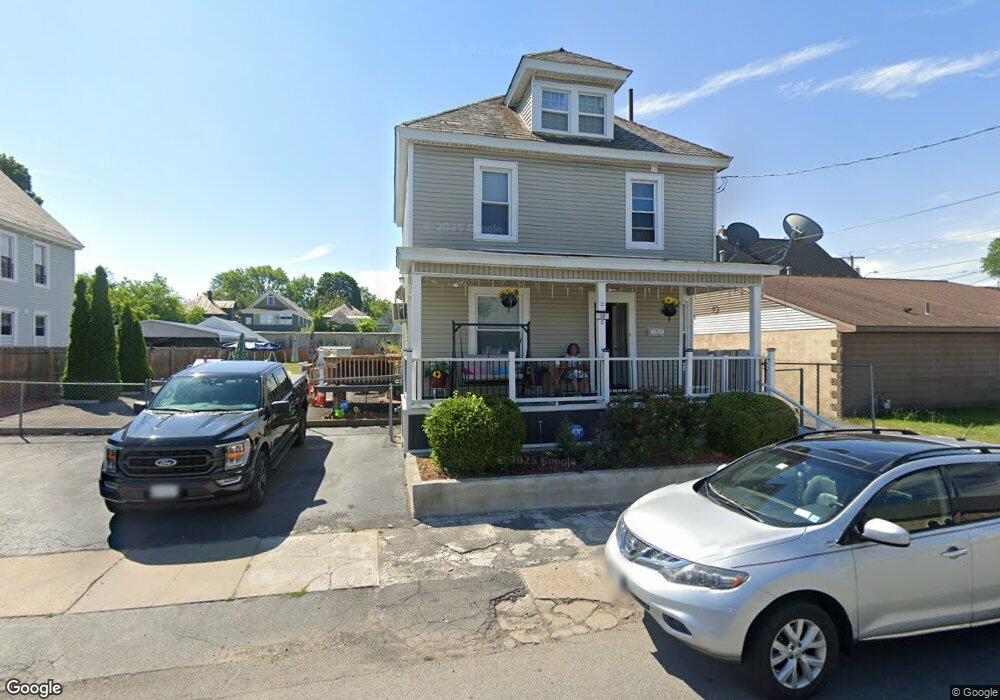
14 Division St Schenectady, NY 12304
Estimated Value: $168,025 - $213,000
3
Beds
1
Bath
1,250
Sq Ft
$148/Sq Ft
Est. Value
About This Home
This home is located at 14 Division St, Schenectady, NY 12304 and is currently estimated at $185,008, approximately $148 per square foot. 14 Division St is a home located in Schenectady County with nearby schools including Lincoln Elementary Community School, Central Park Middle School, and Schenectady High School.
Ownership History
Date
Name
Owned For
Owner Type
Purchase Details
Closed on
Sep 8, 2006
Sold by
Hayden Raymond
Bought by
Singh Mohan
Current Estimated Value
Home Financials for this Owner
Home Financials are based on the most recent Mortgage that was taken out on this home.
Original Mortgage
$6,500
Outstanding Balance
$3,846
Interest Rate
6.59%
Mortgage Type
Purchase Money Mortgage
Estimated Equity
$181,162
Purchase Details
Closed on
Mar 15, 1994
Sold by
Bruce Bartolotto
Bought by
Hayden M R
Create a Home Valuation Report for This Property
The Home Valuation Report is an in-depth analysis detailing your home's value as well as a comparison with similar homes in the area
Purchase History
| Date | Buyer | Sale Price | Title Company |
|---|---|---|---|
| Singh Mohan | $66,000 | David Marinucci | |
| Hayden M R | $63,858 | -- |
Source: Public Records
Mortgage History
| Date | Status | Borrower | Loan Amount |
|---|---|---|---|
| Open | Singh Mohan | $6,500 |
Source: Public Records
Tax History
| Year | Tax Paid | Tax Assessment Tax Assessment Total Assessment is a certain percentage of the fair market value that is determined by local assessors to be the total taxable value of land and additions on the property. | Land | Improvement |
|---|---|---|---|---|
| 2024 | $3,115 | $63,200 | $9,500 | $53,700 |
| 2023 | $30 | $63,200 | $9,500 | $53,700 |
| 2022 | $2,859 | $63,200 | $9,500 | $53,700 |
| 2021 | $2,779 | $63,200 | $9,500 | $53,700 |
| 2020 | $2,681 | $63,200 | $9,500 | $53,700 |
| 2019 | $2,024 | $63,200 | $9,500 | $53,700 |
| 2018 | $2,644 | $63,200 | $9,500 | $53,700 |
| 2017 | $2,277 | $63,200 | $9,500 | $53,700 |
| 2016 | $2,678 | $63,200 | $9,500 | $53,700 |
| 2015 | -- | $63,200 | $9,500 | $53,700 |
| 2014 | -- | $63,200 | $9,500 | $53,700 |
Source: Public Records
Map
Nearby Homes
Your Personal Tour Guide
Ask me questions while you tour the home.