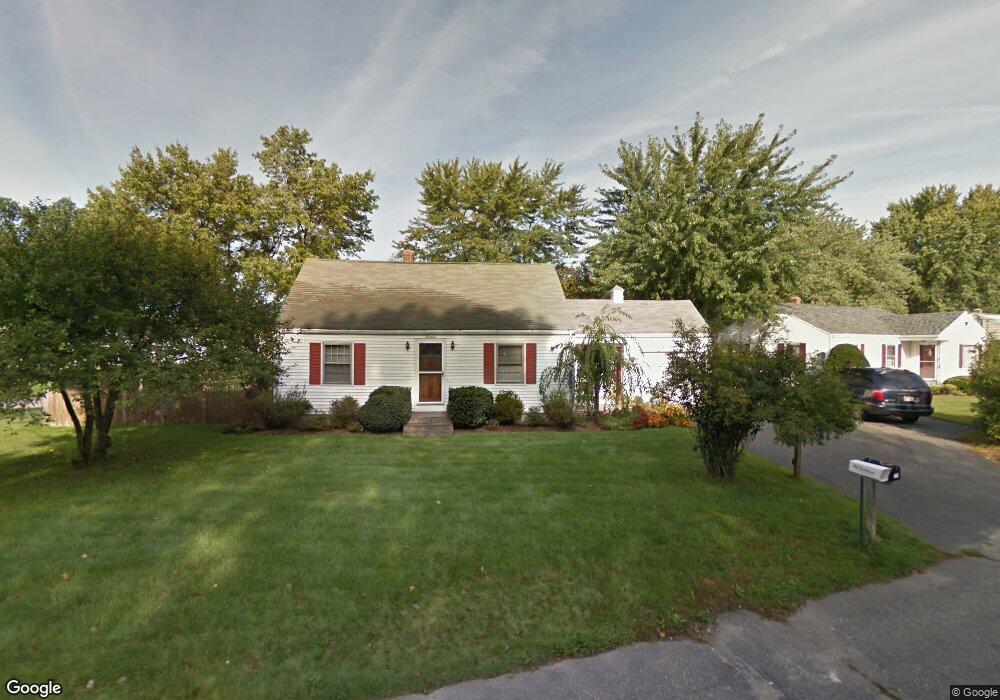
14 Duggan Cir Springfield, MA 01119
Pine Point NeighborhoodEstimated Value: $309,000 - $334,000
3
Beds
2
Baths
1,434
Sq Ft
$224/Sq Ft
Est. Value
About This Home
This home is located at 14 Duggan Cir, Springfield, MA 01119 and is currently estimated at $321,814, approximately $224 per square foot. 14 Duggan Cir is a home located in Hampden County with nearby schools including Thomas M Balliet Elementary School, John J Duggan Middle, and Springfield Central High School.
Ownership History
Date
Name
Owned For
Owner Type
Purchase Details
Closed on
Dec 7, 2016
Sold by
Duffy Geraldine J and Serra David M
Bought by
D M Serra & G J Duffy Re
Current Estimated Value
Purchase Details
Closed on
Jun 6, 1988
Sold by
Mackler Sandra
Bought by
Duffy Geraldine J
Create a Home Valuation Report for This Property
The Home Valuation Report is an in-depth analysis detailing your home's value as well as a comparison with similar homes in the area
Home Values in the Area
Average Home Value in this Area
Purchase History
| Date | Buyer | Sale Price | Title Company |
|---|---|---|---|
| D M Serra & G J Duffy Re | -- | -- | |
| Duffy Geraldine J | $95,000 | -- |
Source: Public Records
Mortgage History
| Date | Status | Borrower | Loan Amount |
|---|---|---|---|
| Previous Owner | Duffy Geraldine J | $61,000 | |
| Previous Owner | Duffy Geraldine J | $57,000 | |
| Previous Owner | Duffy Geraldine J | $68,000 | |
| Previous Owner | Duffy Geraldine J | $75,000 |
Source: Public Records
Tax History Compared to Growth
Tax History
| Year | Tax Paid | Tax Assessment Tax Assessment Total Assessment is a certain percentage of the fair market value that is determined by local assessors to be the total taxable value of land and additions on the property. | Land | Improvement |
|---|---|---|---|---|
| 2025 | $4,329 | $276,100 | $40,100 | $236,000 |
| 2024 | $4,389 | $273,300 | $40,100 | $233,200 |
| 2023 | $3,961 | $232,300 | $35,500 | $196,800 |
| 2022 | $3,207 | $170,400 | $33,100 | $137,300 |
| 2021 | $2,990 | $158,200 | $30,200 | $128,000 |
| 2020 | $3,035 | $155,400 | $30,200 | $125,200 |
| 2019 | $2,865 | $145,600 | $31,200 | $114,400 |
| 2018 | $2,820 | $143,300 | $31,200 | $112,100 |
| 2017 | $2,776 | $141,200 | $34,400 | $106,800 |
| 2016 | $2,697 | $137,200 | $34,400 | $102,800 |
| 2015 | $2,630 | $133,700 | $34,400 | $99,300 |
Source: Public Records
Map
Nearby Homes