Estimated Value: $344,000 - $412,000
3
Beds
1
Bath
700
Sq Ft
$522/Sq Ft
Est. Value
About This Home
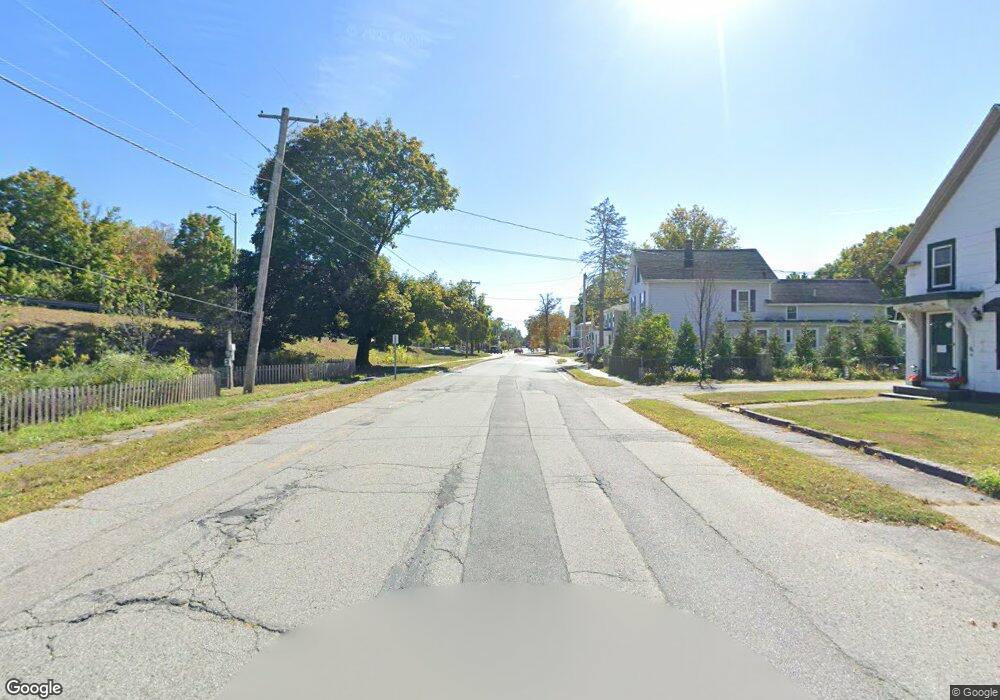
This home is located at 14 E Main St Unit 1, Ayer, MA 01432 and is currently estimated at $365,667, approximately $522 per square foot. 14 E Main St Unit 1 is a home located in Middlesex County with nearby schools including Page Hilltop School, Lura A. White Elementary School, and Ayer Shirley Regional Middle School.
Ownership History
Date
Name
Owned For
Owner Type
Purchase Details
Closed on
Mar 9, 2016
Sold by
Murray Stephen
Bought by
Murray Lt
Current Estimated Value
Purchase Details
Closed on
Jul 1, 2010
Sold by
Wells Fargo Bk
Bought by
Murray Stephen
Purchase Details
Closed on
May 3, 2010
Sold by
Cove Michelle and National City Mtg Loan
Bought by
Wells Fargo Bk and National City Mtg Loan
Purchase Details
Closed on
Aug 21, 1995
Sold by
Household Fin Corp Ii
Bought by
Johnson Todd R
Home Financials for this Owner
Home Financials are based on the most recent Mortgage that was taken out on this home.
Original Mortgage
$48,600
Interest Rate
7.61%
Mortgage Type
Purchase Money Mortgage
Purchase Details
Closed on
Feb 9, 1995
Sold by
Thompson Francis R and Thompson Selma
Bought by
Household Fin Corp Ii
Create a Home Valuation Report for This Property
The Home Valuation Report is an in-depth analysis detailing your home's value as well as a comparison with similar homes in the area
Home Values in the Area
Average Home Value in this Area
Purchase History
| Date | Buyer | Sale Price | Title Company |
|---|---|---|---|
| Murray Lt | -- | -- | |
| Murray Stephen | $84,000 | -- | |
| Wells Fargo Bk | $104,000 | -- | |
| Johnson Todd R | $48,000 | -- | |
| Household Fin Corp Ii | $122,754 | -- |
Source: Public Records
Mortgage History
| Date | Status | Borrower | Loan Amount |
|---|---|---|---|
| Previous Owner | Household Fin Corp Ii | $36,000 | |
| Previous Owner | Household Fin Corp Ii | $48,600 |
Source: Public Records
Tax History
| Year | Tax Paid | Tax Assessment Tax Assessment Total Assessment is a certain percentage of the fair market value that is determined by local assessors to be the total taxable value of land and additions on the property. | Land | Improvement |
|---|---|---|---|---|
| 2025 | $2,580 | $215,700 | $84,800 | $130,900 |
| 2024 | $2,303 | $188,000 | $84,800 | $103,200 |
| 2023 | $2,162 | $174,100 | $79,200 | $94,900 |
| 2022 | $2,161 | $161,000 | $69,100 | $91,900 |
| 2021 | $2,001 | $141,500 | $63,100 | $78,400 |
| 2020 | $1,933 | $137,100 | $64,100 | $73,000 |
| 2019 | $1,780 | $130,600 | $61,100 | $69,500 |
| 2018 | $1,746 | $121,000 | $59,300 | $61,700 |
| 2017 | $1,576 | $109,500 | $50,400 | $59,100 |
| 2016 | $1,556 | $107,100 | $55,800 | $51,300 |
| 2015 | $1,545 | $105,700 | $59,500 | $46,200 |
| 2014 | $1,535 | $109,000 | $59,500 | $49,500 |
Source: Public Records
Map
Nearby Homes
- 21 High St
- 23 Nashua St
- 63 E Main St
- 14 Brook St
- 100 Central Ave Unit 4
- 0ABC Park St
- 98 Pleasant St
- 9 Gaskins Ln
- 24 Harvard Rd Unit C
- 17 Jonathan Dr
- 25 Pine Ridge Dr
- 7 Baldwin Ct Unit 7
- 37 Willard St
- 55 Littleton Rd Unit 21C
- 401 Autumn Ridge Dr
- 75 Sandy Pond Rd Unit 24
- 75 Sandy Pond Rd Unit 41
- 0 Ayer & Old Mill Rd
- 33 Worthen Dr
- 107 Old Mill Rd
- 14 E Main St
- 14 E Main St Unit 14
- 12 E Main St
- 12 E Main St Unit 1
- 10 E Main St Unit 2
- 10 E Main St Unit 1
- 10 E Main St Unit 4
- 10 E Main St Unit 6
- 10 E Main St Unit 3
- 10 E Main St Unit 7
- 10 E Main St
- 6 E Main St
- 11 E Main St
- 9 E Main St Unit 1
- 3 E Main St
- 4 E Main St
- 7 E Main St
- 13 E Main St
- 43 Elm St
- 13 Central Ave
Your Personal Tour Guide
Ask me questions while you tour the home.