Estimated Value: $316,000 - $379,000
3
Beds
2
Baths
1,623
Sq Ft
$212/Sq Ft
Est. Value
About This Home
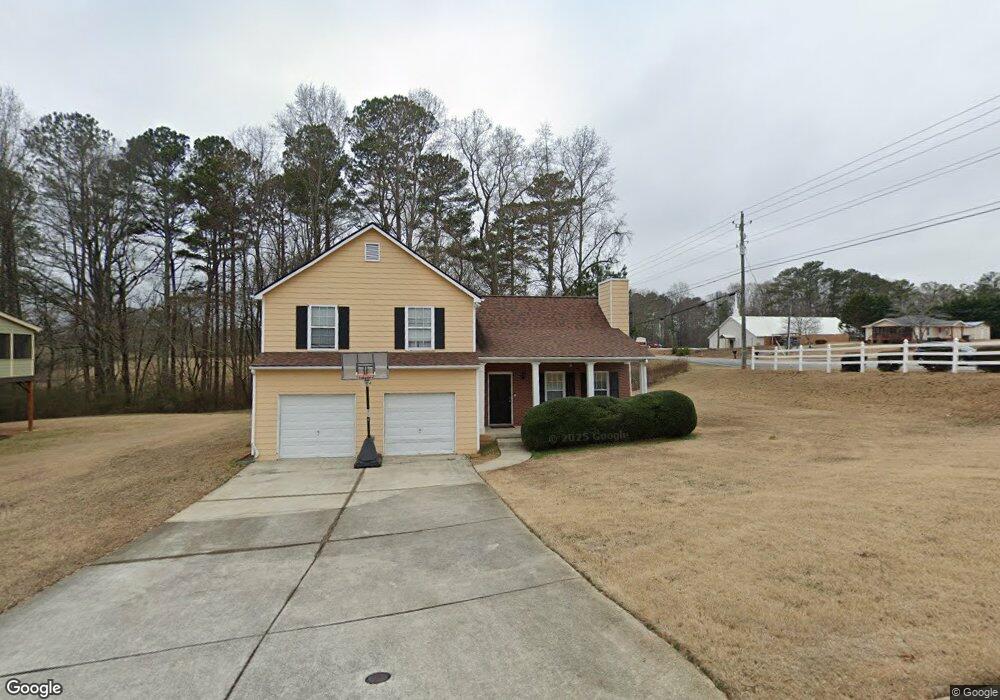
This home is located at 14 Farm St, Hiram, GA 30141 and is currently estimated at $344,510, approximately $212 per square foot. 14 Farm St is a home located in Paulding County with nearby schools including Bessie L. Baggett Elementary School, Irma C. Austin Middle School, and Hiram High School.
Ownership History
Date
Name
Owned For
Owner Type
Purchase Details
Closed on
Sep 5, 2002
Sold by
Raven Homes Inc
Bought by
Rendon Jose and Rendon Luz M
Current Estimated Value
Home Financials for this Owner
Home Financials are based on the most recent Mortgage that was taken out on this home.
Original Mortgage
$136,400
Outstanding Balance
$56,854
Interest Rate
6.21%
Mortgage Type
FHA
Estimated Equity
$287,656
Purchase Details
Closed on
Jun 13, 2001
Sold by
Four Star Building Group Inc
Bought by
Raven Homes Inc
Create a Home Valuation Report for This Property
The Home Valuation Report is an in-depth analysis detailing your home's value as well as a comparison with similar homes in the area
Home Values in the Area
Average Home Value in this Area
Purchase History
| Date | Buyer | Sale Price | Title Company |
|---|---|---|---|
| Rendon Jose | $137,600 | -- | |
| Raven Homes Inc | -- | -- |
Source: Public Records
Mortgage History
| Date | Status | Borrower | Loan Amount |
|---|---|---|---|
| Open | Rendon Jose | $136,400 |
Source: Public Records
Tax History Compared to Growth
Tax History
| Year | Tax Paid | Tax Assessment Tax Assessment Total Assessment is a certain percentage of the fair market value that is determined by local assessors to be the total taxable value of land and additions on the property. | Land | Improvement |
|---|---|---|---|---|
| 2024 | $3,112 | $128,348 | $12,000 | $116,348 |
| 2023 | $3,211 | $125,688 | $12,000 | $113,688 |
| 2022 | $2,770 | $108,116 | $12,000 | $96,116 |
| 2021 | $2,371 | $83,456 | $10,000 | $73,456 |
| 2020 | $2,308 | $79,556 | $10,000 | $69,556 |
| 2019 | $2,229 | $75,840 | $10,000 | $65,840 |
| 2018 | $1,989 | $67,880 | $10,000 | $57,880 |
| 2017 | $1,744 | $58,960 | $8,800 | $50,160 |
| 2016 | $1,748 | $59,680 | $8,800 | $50,880 |
| 2015 | $1,430 | $48,320 | $8,800 | $39,520 |
| 2014 | $986 | $33,084 | $8,800 | $24,284 |
| 2013 | -- | $33,560 | $8,800 | $24,760 |
Source: Public Records
Map
Nearby Homes