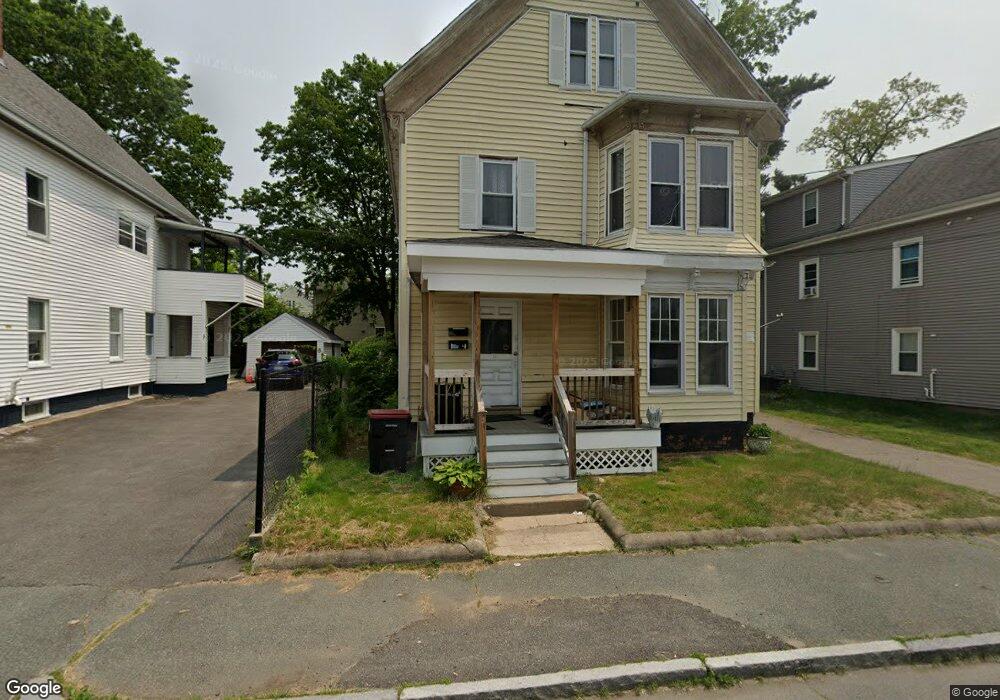
14 Fulton St Brockton, MA 02301
Clifton Heights NeighborhoodEstimated Value: $575,062 - $814,000
6
Beds
2
Baths
2,668
Sq Ft
$269/Sq Ft
Est. Value
About This Home
This home is located at 14 Fulton St, Brockton, MA 02301 and is currently estimated at $718,016, approximately $269 per square foot. 14 Fulton St is a home located in Plymouth County with nearby schools including Davis K-8 School, John F. Kennedy Elementary School, and South Middle School.
Ownership History
Date
Name
Owned For
Owner Type
Purchase Details
Closed on
Feb 5, 2021
Sold by
Dyna Mor Services Inc
Bought by
Mor George
Current Estimated Value
Purchase Details
Closed on
Jun 30, 1994
Sold by
Fnma
Bought by
Dyna-Mor Services Inc
Purchase Details
Closed on
May 19, 1994
Sold by
Sean Rath and Vong Sharon
Bought by
Bristol Mtg Corp
Purchase Details
Closed on
Feb 9, 1989
Sold by
Andrade Ildo
Bought by
Sean Rath
Home Financials for this Owner
Home Financials are based on the most recent Mortgage that was taken out on this home.
Original Mortgage
$148,500
Interest Rate
10.73%
Mortgage Type
Purchase Money Mortgage
Create a Home Valuation Report for This Property
The Home Valuation Report is an in-depth analysis detailing your home's value as well as a comparison with similar homes in the area
Home Values in the Area
Average Home Value in this Area
Purchase History
| Date | Buyer | Sale Price | Title Company |
|---|---|---|---|
| Mor George | -- | None Available | |
| Dyna-Mor Services Inc | $18,000 | -- | |
| Bristol Mtg Corp | $45,000 | -- | |
| Sean Rath | $165,000 | -- |
Source: Public Records
Mortgage History
| Date | Status | Borrower | Loan Amount |
|---|---|---|---|
| Previous Owner | Sean Rath | $148,500 | |
| Previous Owner | Sean Rath | $120,000 |
Source: Public Records
Tax History Compared to Growth
Tax History
| Year | Tax Paid | Tax Assessment Tax Assessment Total Assessment is a certain percentage of the fair market value that is determined by local assessors to be the total taxable value of land and additions on the property. | Land | Improvement |
|---|---|---|---|---|
| 2025 | $7,188 | $593,600 | $135,400 | $458,200 |
| 2024 | $6,505 | $541,200 | $135,400 | $405,800 |
| 2023 | $5,724 | $441,000 | $101,500 | $339,500 |
| 2022 | $5,676 | $406,300 | $92,000 | $314,300 |
| 2021 | $5,140 | $354,500 | $76,000 | $278,500 |
| 2020 | $4,490 | $296,400 | $71,800 | $224,600 |
| 2019 | $4,494 | $289,200 | $69,200 | $220,000 |
| 2018 | $3,399 | $243,300 | $69,200 | $174,100 |
| 2017 | $3,399 | $211,100 | $69,200 | $141,900 |
| 2016 | $2,998 | $172,700 | $67,100 | $105,600 |
| 2015 | $2,595 | $143,000 | $67,100 | $75,900 |
| 2014 | $2,642 | $145,700 | $67,100 | $78,600 |
Source: Public Records
Map
Nearby Homes