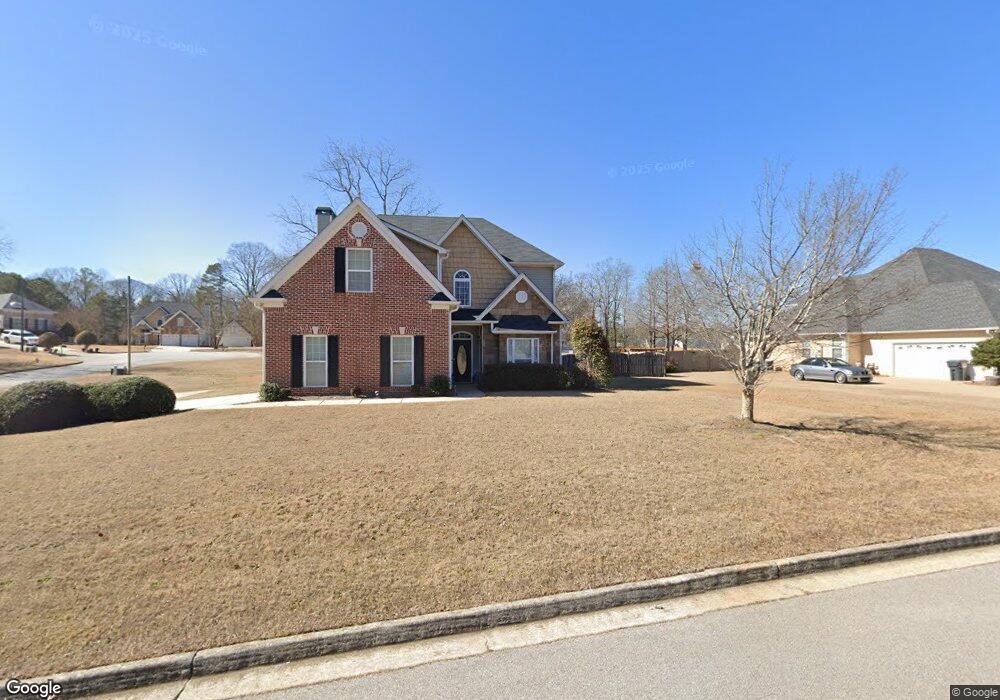
14 Gannon Gap Douglasville, GA 30134
Estimated Value: $352,844 - $434,000
4
Beds
3
Baths
2,079
Sq Ft
$189/Sq Ft
Est. Value
About This Home
This home is located at 14 Gannon Gap, Douglasville, GA 30134 and is currently estimated at $392,211, approximately $188 per square foot. 14 Gannon Gap is a home located in Paulding County with nearby schools including New Georgia Elementary School, Carl Scoggins Sr. Middle School, and South Paulding High School.
Ownership History
Date
Name
Owned For
Owner Type
Purchase Details
Closed on
Nov 19, 2013
Sold by
Thr Georgia Lp
Bought by
2013 1 Ih Borrower Lp
Current Estimated Value
Purchase Details
Closed on
Oct 2, 2012
Sold by
Hayles Kris
Bought by
Thr Georgia Llc
Purchase Details
Closed on
Mar 9, 2009
Sold by
Hud-Housing Of Urban Dev
Bought by
Hayles Kris
Home Financials for this Owner
Home Financials are based on the most recent Mortgage that was taken out on this home.
Original Mortgage
$147,435
Interest Rate
5.14%
Mortgage Type
FHA
Purchase Details
Closed on
Apr 1, 2008
Sold by
Taylor Bean & Whitaker Mtg
Bought by
Hud-Housing Of Urban Dev
Purchase Details
Closed on
Oct 25, 2006
Sold by
Rose Creek Properties Llc
Bought by
Bonilla Robert W
Home Financials for this Owner
Home Financials are based on the most recent Mortgage that was taken out on this home.
Original Mortgage
$219,456
Interest Rate
6.31%
Mortgage Type
FHA
Create a Home Valuation Report for This Property
The Home Valuation Report is an in-depth analysis detailing your home's value as well as a comparison with similar homes in the area
Home Values in the Area
Average Home Value in this Area
Purchase History
| Date | Buyer | Sale Price | Title Company |
|---|---|---|---|
| 2013 1 Ih Borrower Lp | -- | -- | |
| Thr Georgia Llc | $81,100 | -- | |
| Hayles Kris | -- | -- | |
| Hud-Housing Of Urban Dev | -- | -- | |
| Taylor Bean & Whitaker Mtg | $235,913 | -- | |
| Bonilla Robert W | $222,900 | -- |
Source: Public Records
Mortgage History
| Date | Status | Borrower | Loan Amount |
|---|---|---|---|
| Previous Owner | Hayles Kris | $147,435 | |
| Previous Owner | Bonilla Robert W | $219,456 |
Source: Public Records
Tax History Compared to Growth
Tax History
| Year | Tax Paid | Tax Assessment Tax Assessment Total Assessment is a certain percentage of the fair market value that is determined by local assessors to be the total taxable value of land and additions on the property. | Land | Improvement |
|---|---|---|---|---|
| 2024 | $3,457 | $138,972 | $16,000 | $122,972 |
| 2023 | $2,444 | $93,748 | $16,000 | $77,748 |
| 2022 | $2,444 | $93,748 | $16,000 | $77,748 |
| 2021 | $2,724 | $93,748 | $16,000 | $77,748 |
| 2020 | $2,475 | $83,348 | $16,000 | $67,348 |
| 2019 | $2,408 | $79,920 | $16,000 | $63,920 |
| 2018 | $2,309 | $76,640 | $16,000 | $60,640 |
| 2017 | $2,215 | $72,520 | $16,000 | $56,520 |
| 2016 | $1,978 | $65,400 | $16,000 | $49,400 |
| 2015 | $2,013 | $65,400 | $16,000 | $49,400 |
| 2014 | $2,064 | $65,400 | $16,000 | $49,400 |
| 2013 | -- | $59,800 | $16,000 | $43,800 |
Source: Public Records
Map
Nearby Homes
- 11 Gannon Gap
- 46 Ridge Brooke Dr
- 107 Little John Way
- 174 Ridge Brooke Ln
- 65 Ridgefield Dr
- 31 Marion Ln
- 391 Hudson Cir
- 268 Woodridge Dr
- 246 Hudson Cir
- 46 Legend Creek Hollow
- 40 Legend Creek Chase
- 45 Hollow Ct
- 33 Rotunda Ct
- 200 Brookwood Crossing
- 35 Lady Morgan Ln
- 178 Seals Dr
- 340 Garretts Dr
- 1890 Seals Rd
- 0 Gannon Cap Ct Unit 3206876
- 14 Gannon Cap Ct
- 0 Gannon Gap Unit 3269797
- 0 Gannon Gap
- 0 Fullerton Ridge Dr Unit 3186747
- 0 Fullerton Ridge Dr Unit 3171328
- 0 Fullerton Ridge Dr Unit 8206601
- 0 Fullerton Ridge Dr
- 48 Gannon Gap
- 26 Fullerton Ridge
- 41 Fullerton Ridge
- 67 Fullerton Ridge
- 91 Fullerton Ridge Dr
- 91 Fullerton Ridge
- 19 Fullerton Ridge
- 56 Gannon Gap
- 55 Gannon Gap
- 61 Gannon Gap
- 113 Fullerton Ridge
- 224 Ridgefield Dr