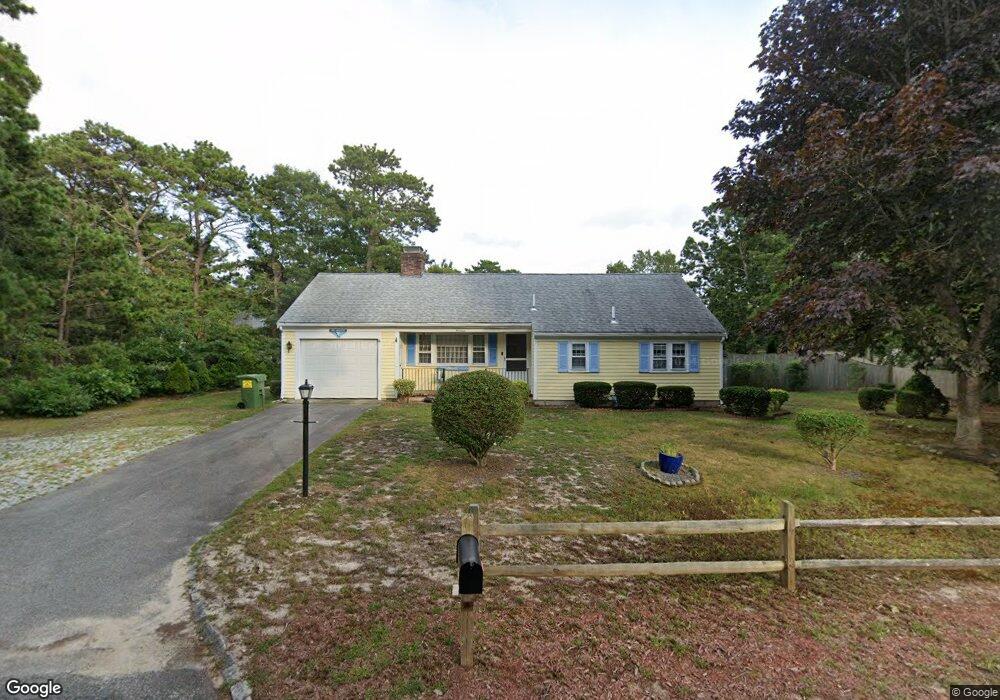
14 Hatch Rd South Yarmouth, MA 02664
Estimated Value: $480,000 - $551,000
2
Beds
1
Bath
800
Sq Ft
$639/Sq Ft
Est. Value
About This Home
This home is located at 14 Hatch Rd, South Yarmouth, MA 02664 and is currently estimated at $510,946, approximately $638 per square foot. 14 Hatch Rd is a home located in Barnstable County with nearby schools including Dennis-Yarmouth Regional High School and St. Pius X. School.
Ownership History
Date
Name
Owned For
Owner Type
Purchase Details
Closed on
Oct 18, 2013
Sold by
Richardson James C and Richardson Elsie
Bought by
Richardson Ret
Current Estimated Value
Purchase Details
Closed on
Oct 20, 1997
Sold by
Byrne Irt and Byrne Jerome F
Bought by
Richardson James C and Richardson Elsie
Home Financials for this Owner
Home Financials are based on the most recent Mortgage that was taken out on this home.
Original Mortgage
$87,600
Interest Rate
7.46%
Mortgage Type
Purchase Money Mortgage
Create a Home Valuation Report for This Property
The Home Valuation Report is an in-depth analysis detailing your home's value as well as a comparison with similar homes in the area
Home Values in the Area
Average Home Value in this Area
Purchase History
| Date | Buyer | Sale Price | Title Company |
|---|---|---|---|
| Richardson Ret | -- | -- | |
| Richardson James C | $109,600 | -- |
Source: Public Records
Mortgage History
| Date | Status | Borrower | Loan Amount |
|---|---|---|---|
| Previous Owner | Richardson James C | $87,600 |
Source: Public Records
Tax History Compared to Growth
Tax History
| Year | Tax Paid | Tax Assessment Tax Assessment Total Assessment is a certain percentage of the fair market value that is determined by local assessors to be the total taxable value of land and additions on the property. | Land | Improvement |
|---|---|---|---|---|
| 2025 | $3,233 | $456,700 | $173,900 | $282,800 |
| 2024 | $3,032 | $410,900 | $151,300 | $259,600 |
| 2023 | $2,915 | $359,400 | $131,000 | $228,400 |
| 2022 | $2,757 | $300,300 | $119,000 | $181,300 |
| 2021 | $2,603 | $272,300 | $119,000 | $153,300 |
| 2020 | $2,814 | $255,500 | $119,000 | $136,500 |
| 2019 | $2,715 | $235,300 | $119,000 | $116,300 |
| 2018 | $2,240 | $217,700 | $101,400 | $116,300 |
| 2017 | $2,137 | $213,300 | $97,000 | $116,300 |
| 2016 | $2,041 | $204,500 | $88,200 | $116,300 |
| 2015 | $1,921 | $191,300 | $88,200 | $103,100 |
Source: Public Records
Map
Nearby Homes