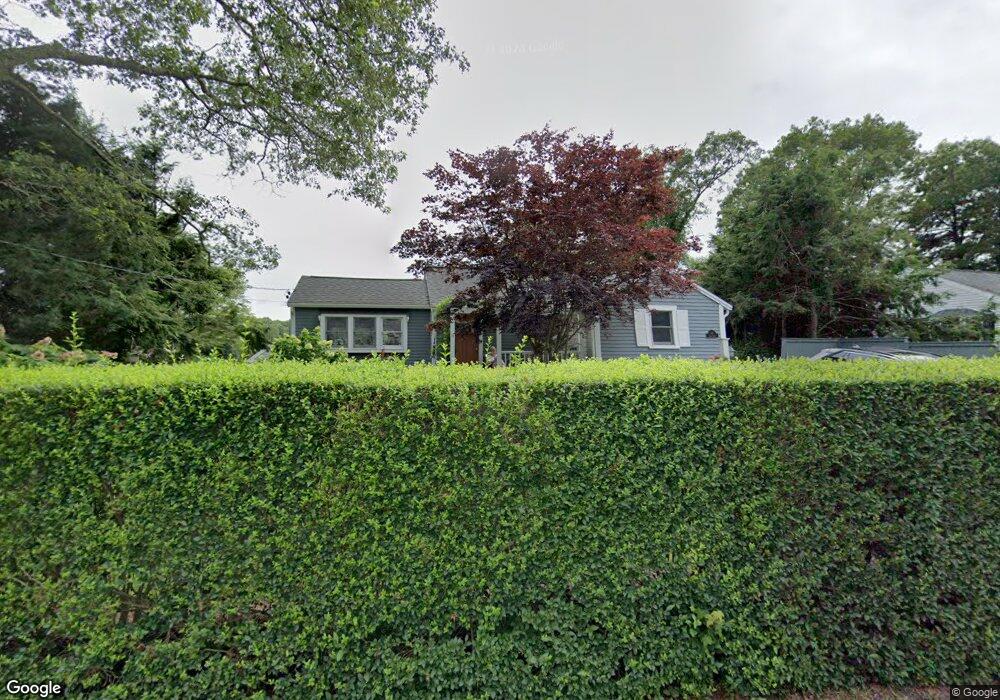
14 Lake Dr Pocasset, MA 02559
Pocasset NeighborhoodEstimated Value: $516,000 - $619,399
3
Beds
1
Bath
998
Sq Ft
$566/Sq Ft
Est. Value
About This Home
This home is located at 14 Lake Dr, Pocasset, MA 02559 and is currently estimated at $564,850, approximately $565 per square foot. 14 Lake Dr is a home located in Barnstable County with nearby schools including Bourne High School, Cadence Academy Preschool - Bourne, and St Margaret Regional School.
Ownership History
Date
Name
Owned For
Owner Type
Purchase Details
Closed on
Jun 29, 2001
Sold by
Dwight Robert A and Dwight Margret L
Bought by
Lavalley Roy R and Lavalley Carol S
Current Estimated Value
Home Financials for this Owner
Home Financials are based on the most recent Mortgage that was taken out on this home.
Original Mortgage
$144,000
Interest Rate
7.14%
Mortgage Type
Purchase Money Mortgage
Create a Home Valuation Report for This Property
The Home Valuation Report is an in-depth analysis detailing your home's value as well as a comparison with similar homes in the area
Home Values in the Area
Average Home Value in this Area
Purchase History
| Date | Buyer | Sale Price | Title Company |
|---|---|---|---|
| Lavalley Roy R | $160,000 | -- | |
| Lavalley Roy R | $160,000 | -- |
Source: Public Records
Mortgage History
| Date | Status | Borrower | Loan Amount |
|---|---|---|---|
| Open | Lavalley Roy R | $144,000 | |
| Closed | Lavalley Roy R | $144,000 |
Source: Public Records
Tax History Compared to Growth
Tax History
| Year | Tax Paid | Tax Assessment Tax Assessment Total Assessment is a certain percentage of the fair market value that is determined by local assessors to be the total taxable value of land and additions on the property. | Land | Improvement |
|---|---|---|---|---|
| 2025 | $4,072 | $521,400 | $253,000 | $268,400 |
| 2024 | $3,983 | $496,600 | $241,000 | $255,600 |
| 2023 | $3,872 | $439,500 | $213,300 | $226,200 |
| 2022 | $3,453 | $342,200 | $162,700 | $179,500 |
| 2021 | $2,760 | $256,300 | $148,100 | $108,200 |
| 2020 | $2,676 | $249,200 | $146,700 | $102,500 |
| 2019 | $2,559 | $243,500 | $146,700 | $96,800 |
| 2018 | $2,394 | $227,100 | $139,700 | $87,400 |
| 2017 | $2,430 | $235,900 | $149,400 | $86,500 |
| 2016 | $2,336 | $229,900 | $160,500 | $69,400 |
| 2015 | $2,093 | $207,800 | $138,400 | $69,400 |
Source: Public Records
Map
Nearby Homes
- 7 4th Ave
- 15 1st St
- 7 Portside Dr
- 174 Barlows Landing Rd
- 940 County Rd
- 940 County Rd
- 709 County Rd
- 254 Barlows Landing Rd
- 39 Bennets Neck Dr
- 1094 County Rd
- 3 Red Brook Pond Dr
- 171 Bellavista Dr
- 48 Red Brook Harbor Rd
- 22 Nairn Rd
- 515 County Rd
- 14 Navajo Rd
- 1234 Route 28a
- 501 County Rd
- 16 Tara Terrace
- 1234 Route 28a