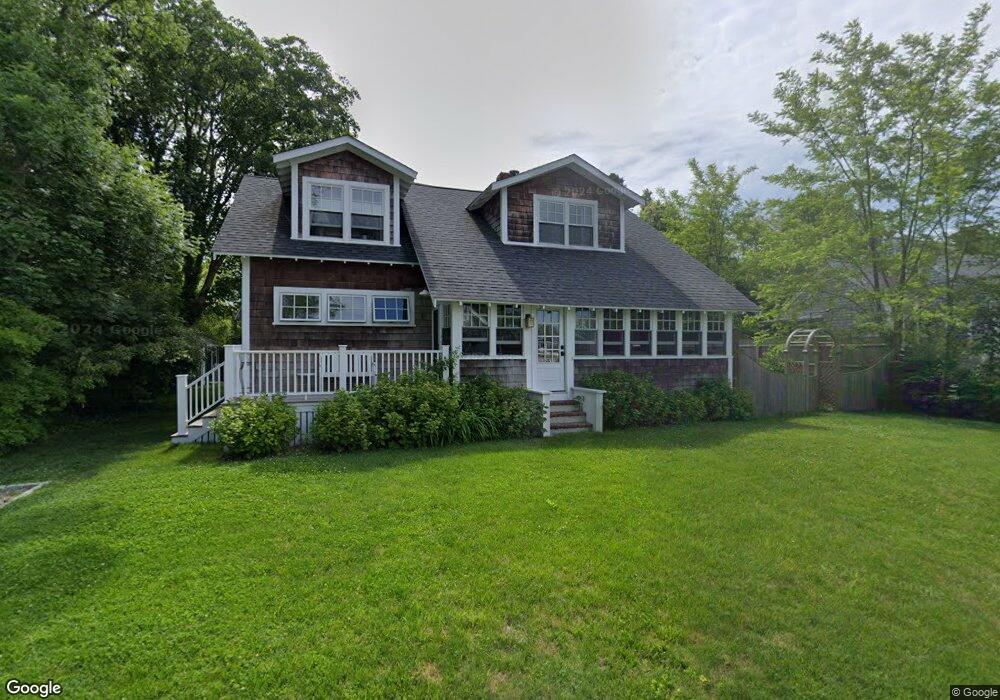
14 Locust Ln Barnstable, MA 02630
Barnstable Village NeighborhoodEstimated Value: $1,064,000 - $1,339,000
3
Beds
1
Bath
1,634
Sq Ft
$696/Sq Ft
Est. Value
About This Home
This home is located at 14 Locust Ln, Barnstable, MA 02630 and is currently estimated at $1,137,089, approximately $695 per square foot. 14 Locust Ln is a home located in Barnstable County with nearby schools including West Barnstable Elementary School, Barnstable United Elementary School, and Barnstable Intermediate School.
Ownership History
Date
Name
Owned For
Owner Type
Purchase Details
Closed on
Aug 2, 2004
Sold by
Holmes Thelma C
Bought by
Martin Jonathan A
Current Estimated Value
Create a Home Valuation Report for This Property
The Home Valuation Report is an in-depth analysis detailing your home's value as well as a comparison with similar homes in the area
Home Values in the Area
Average Home Value in this Area
Purchase History
| Date | Buyer | Sale Price | Title Company |
|---|---|---|---|
| Martin Jonathan A | $380,000 | -- |
Source: Public Records
Tax History Compared to Growth
Tax History
| Year | Tax Paid | Tax Assessment Tax Assessment Total Assessment is a certain percentage of the fair market value that is determined by local assessors to be the total taxable value of land and additions on the property. | Land | Improvement |
|---|---|---|---|---|
| 2025 | $9,216 | $997,400 | $558,200 | $439,200 |
| 2024 | $10,439 | $1,191,700 | $767,500 | $424,200 |
| 2023 | $9,112 | $1,014,700 | $634,300 | $380,400 |
| 2022 | $8,233 | $737,700 | $413,500 | $324,200 |
| 2021 | $7,692 | $656,900 | $375,900 | $281,000 |
| 2020 | $2,179 | $655,500 | $375,900 | $279,600 |
| 2019 | $7,947 | $650,300 | $394,700 | $255,600 |
| 2018 | $2,124 | $602,100 | $375,900 | $226,200 |
| 2017 | $2,023 | $594,200 | $375,900 | $218,300 |
| 2016 | $5,900 | $478,500 | $396,200 | $82,300 |
| 2015 | $5,588 | $461,400 | $369,500 | $91,900 |
Source: Public Records
Map
Nearby Homes
- 110 Commerce Rd
- 3528 Main St
- 21 Indian Trail
- 17 Indian Trail
- 30 Indian Trail
- 0 Indian Trail
- 240 Braggs Ln
- 294 Salt Rock Rd
- 41 Dromoland Ln
- 44 Iris Ln
- 93 Harris Meadow Ln
- 92 Brentwood Dr
- 92 Brentwood Ln
- 4390 Main St
- 65 Oakmont Rd
- 33 Midpine Rd
- 2656 Main St
- 0 Phinneys Ln
- 56 Wharf Ln
- 25 Congressional Dr