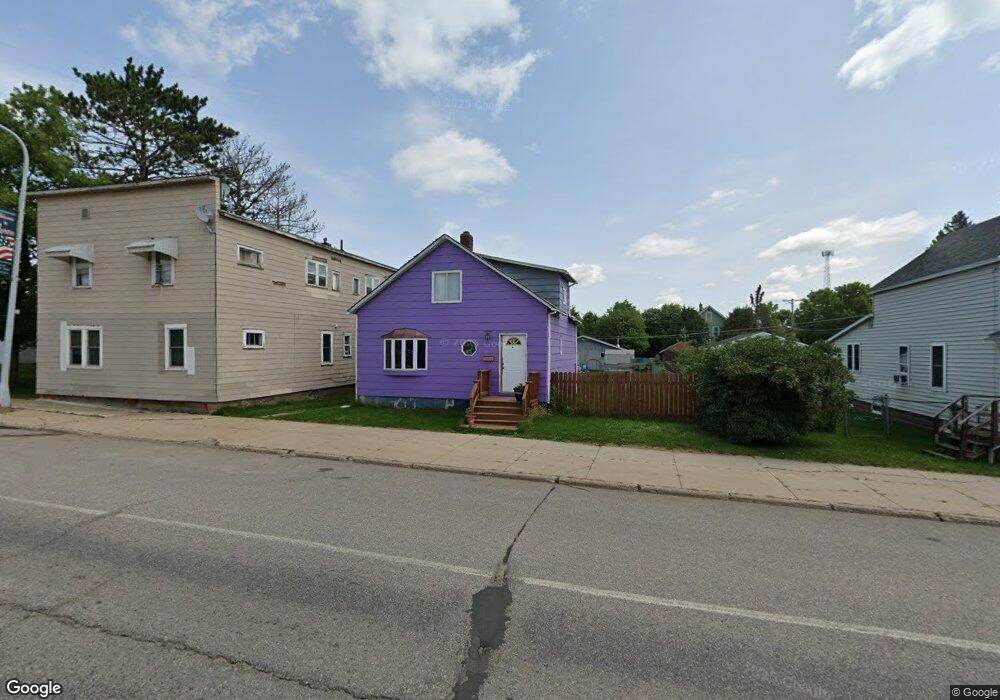
14 Main St N Aurora, MN 55705
Estimated Value: $92,000 - $165,865
3
Beds
2
Baths
1,104
Sq Ft
$105/Sq Ft
Est. Value
About This Home
This home is located at 14 Main St N, Aurora, MN 55705 and is currently estimated at $116,216, approximately $105 per square foot. 14 Main St N is a home located in St. Louis County with nearby schools including Mesabi East Elementary School and Mesabi East Secondary School.
Ownership History
Date
Name
Owned For
Owner Type
Purchase Details
Closed on
Sep 10, 2015
Sold by
Secretary Of Housing & Urban Development
Bought by
Johnson Joshua G
Current Estimated Value
Home Financials for this Owner
Home Financials are based on the most recent Mortgage that was taken out on this home.
Original Mortgage
$18,320
Interest Rate
3.82%
Mortgage Type
New Conventional
Purchase Details
Closed on
Dec 2, 2014
Sold by
Wells Fargo Bank Na
Bought by
Secretary Of Housing & Urban Development
Purchase Details
Closed on
Oct 6, 2014
Sold by
Peterson Anders C
Bought by
Wells Fargo Bank Na
Purchase Details
Closed on
Sep 20, 2002
Sold by
Robinson Robert L and Robinson Laurie A
Bought by
Peterson Anders C
Home Financials for this Owner
Home Financials are based on the most recent Mortgage that was taken out on this home.
Original Mortgage
$47,096
Interest Rate
6%
Mortgage Type
FHA
Create a Home Valuation Report for This Property
The Home Valuation Report is an in-depth analysis detailing your home's value as well as a comparison with similar homes in the area
Home Values in the Area
Average Home Value in this Area
Purchase History
| Date | Buyer | Sale Price | Title Company |
|---|---|---|---|
| Johnson Joshua G | -- | All American Title Co | |
| Secretary Of Housing & Urban Development | -- | Attorney | |
| Wells Fargo Bank Na | $23,294 | None Available | |
| Peterson Anders C | $47,000 | Ati Title Company |
Source: Public Records
Mortgage History
| Date | Status | Borrower | Loan Amount |
|---|---|---|---|
| Previous Owner | Johnson Joshua G | $18,320 | |
| Previous Owner | Peterson Anders C | $47,096 |
Source: Public Records
Tax History Compared to Growth
Tax History
| Year | Tax Paid | Tax Assessment Tax Assessment Total Assessment is a certain percentage of the fair market value that is determined by local assessors to be the total taxable value of land and additions on the property. | Land | Improvement |
|---|---|---|---|---|
| 2024 | $552 | $74,400 | $6,000 | $68,400 |
| 2023 | $552 | $71,000 | $6,000 | $65,000 |
| 2022 | $218 | $55,300 | $3,000 | $52,300 |
| 2021 | $212 | $39,400 | $2,600 | $36,800 |
| 2020 | $156 | $35,800 | $2,600 | $33,200 |
| 2019 | $156 | $35,800 | $2,600 | $33,200 |
| 2018 | $194 | $35,700 | $2,500 | $33,200 |
| 2017 | $266 | $40,200 | $4,100 | $36,100 |
| 2016 | $242 | $46,300 | $4,100 | $42,200 |
| 2015 | $248 | $22,600 | $2,000 | $20,600 |
| 2014 | $217 | $23,800 | $2,100 | $21,700 |
Source: Public Records
Map
Nearby Homes
- 15 W 4th Ave N
- 102 W 3rd Ave N
- 112 W 3rd Ave N
- 213 & 215 W 4th Ave N
- 15 E 3rd Ave S
- 304 W 3rd Ave N
- 213 S 2nd St W
- 311 W 2nd Ave N
- 316 W 3rd Ave N
- 306 S 2nd St W
- 313 S 2nd St W
- 204 S 5th St E
- 408 S 2nd St E
- 307 S 6th St E
- 31 S Erie St
- 421 Main St S
- 5316 Highway 110
- TBD Lane 55 County Road 341
- 5186 Road 51
- XXXX Road 53