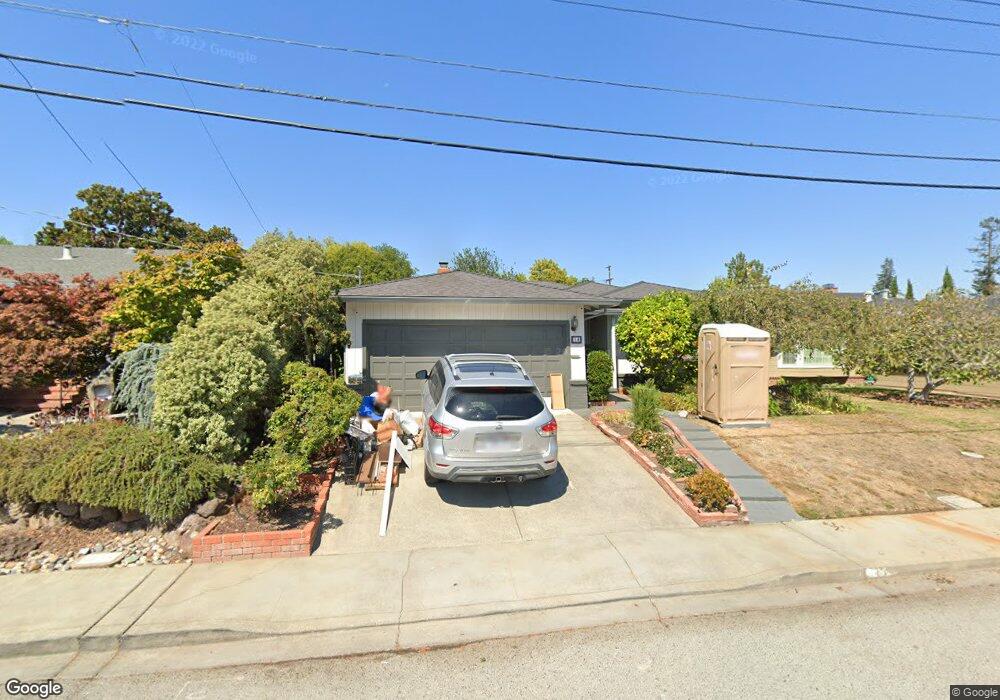
14 Maple Way San Carlos, CA 94070
Alder Manor NeighborhoodEstimated Value: $1,956,000 - $2,312,000
3
Beds
2
Baths
1,490
Sq Ft
$1,450/Sq Ft
Est. Value
About This Home
This home is located at 14 Maple Way, San Carlos, CA 94070 and is currently estimated at $2,160,139, approximately $1,449 per square foot. 14 Maple Way is a home located in San Mateo County with nearby schools including Clifford School, John F. Kennedy Middle School, and Sequoia High School.
Ownership History
Date
Name
Owned For
Owner Type
Purchase Details
Closed on
Sep 9, 2014
Sold by
Soriano Frederick B and Su Linda Yung
Bought by
Soriano Frederick B and Su Linda Yung
Current Estimated Value
Home Financials for this Owner
Home Financials are based on the most recent Mortgage that was taken out on this home.
Original Mortgage
$500,000
Outstanding Balance
$382,216
Interest Rate
4.1%
Mortgage Type
New Conventional
Estimated Equity
$1,777,923
Purchase Details
Closed on
Mar 8, 2012
Sold by
Payne Joanne M
Bought by
Soriano Frederick B and Su Linda Yung
Home Financials for this Owner
Home Financials are based on the most recent Mortgage that was taken out on this home.
Original Mortgage
$523,250
Interest Rate
5.25%
Mortgage Type
New Conventional
Purchase Details
Closed on
Aug 29, 2001
Sold by
Payne Merl H and Payne Joanne M
Bought by
Payne Merl H and Payne Joanne M
Create a Home Valuation Report for This Property
The Home Valuation Report is an in-depth analysis detailing your home's value as well as a comparison with similar homes in the area
Home Values in the Area
Average Home Value in this Area
Purchase History
| Date | Buyer | Sale Price | Title Company |
|---|---|---|---|
| Soriano Frederick B | -- | Chicago Title Company | |
| Soriano Frederick B | $805,000 | First American Title Company | |
| Payne Merl H | -- | -- |
Source: Public Records
Mortgage History
| Date | Status | Borrower | Loan Amount |
|---|---|---|---|
| Open | Soriano Frederick B | $500,000 | |
| Closed | Soriano Frederick B | $523,250 |
Source: Public Records
Tax History
| Year | Tax Paid | Tax Assessment Tax Assessment Total Assessment is a certain percentage of the fair market value that is determined by local assessors to be the total taxable value of land and additions on the property. | Land | Improvement |
|---|---|---|---|---|
| 2025 | $13,152 | $1,155,729 | $816,430 | $339,299 |
| 2023 | $13,152 | $1,033,853 | $784,728 | $249,125 |
| 2022 | $11,749 | $952,798 | $769,342 | $183,456 |
| 2021 | $11,587 | $934,116 | $754,257 | $179,859 |
| 2020 | $11,392 | $924,539 | $746,524 | $178,015 |
| 2019 | $11,306 | $906,412 | $731,887 | $174,525 |
| 2018 | $10,994 | $888,640 | $717,537 | $171,103 |
| 2017 | $10,847 | $871,217 | $703,468 | $167,749 |
| 2016 | $10,694 | $854,135 | $689,675 | $164,460 |
| 2015 | $10,339 | $841,306 | $679,316 | $161,990 |
| 2014 | $10,098 | $824,827 | $666,010 | $158,817 |
Source: Public Records
Map
Nearby Homes
- 2780 Bromley Dr
- 11 Krista Ln
- 2084 Saint Francis Way
- 1235 Edgewood Rd
- 1277 Edgewood Rd
- 0 S Palomar Dr
- 1353 Edgewood Rd
- 230 Rockridge Rd
- 00 S Palomar Dr
- 2024 Eaton Ave
- 416 Palomar Dr
- 90 Melrose Place
- 1698 Cordilleras Rd
- 878 Hillcrest Dr
- 404 Portofino Dr Unit 3
- 1316 Rosewood Ave
- 1385 Elm St
- 125 Warwick St
- 65 Madera Ave
- 726 Hillcrest Dr
Your Personal Tour Guide
Ask me questions while you tour the home.