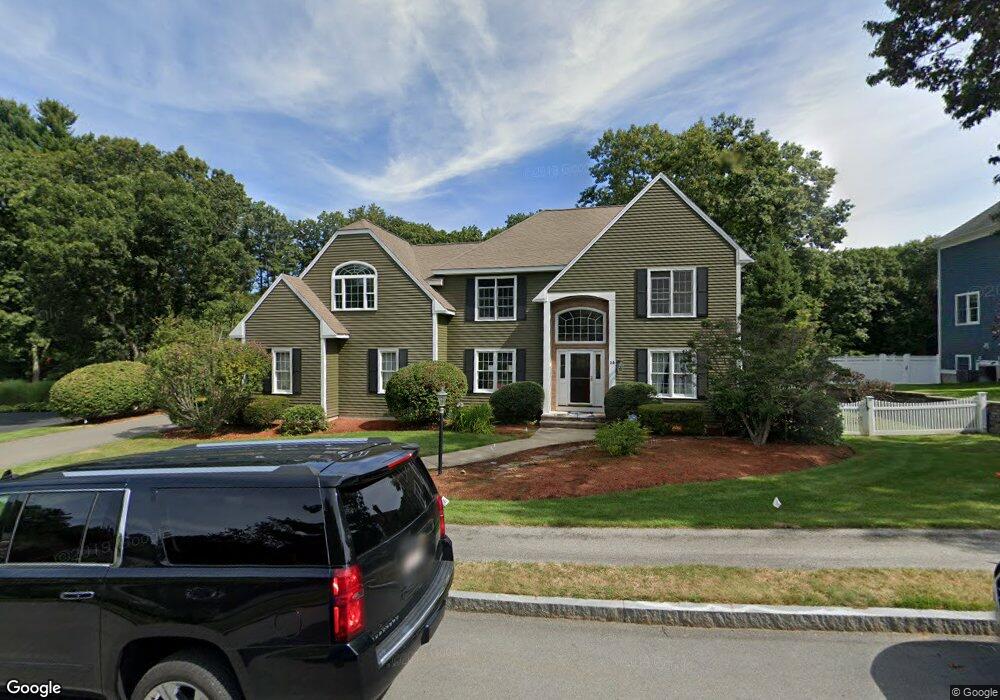
14 Michael Dr Burlington, MA 01803
North Burlington NeighborhoodEstimated Value: $1,132,718 - $1,391,000
4
Beds
3
Baths
3,400
Sq Ft
$371/Sq Ft
Est. Value
About This Home
This home is located at 14 Michael Dr, Burlington, MA 01803 and is currently estimated at $1,260,680, approximately $370 per square foot. 14 Michael Dr is a home located in Middlesex County with nearby schools including Wilmington Middle School and Wilmington High School.
Ownership History
Date
Name
Owned For
Owner Type
Purchase Details
Closed on
Sep 29, 2010
Sold by
Marrano Robert P and Marrano Elise K
Bought by
Monaco Elizabeth M and Mansfield Paul M
Current Estimated Value
Home Financials for this Owner
Home Financials are based on the most recent Mortgage that was taken out on this home.
Original Mortgage
$523,750
Outstanding Balance
$345,849
Interest Rate
4.44%
Mortgage Type
Purchase Money Mortgage
Estimated Equity
$914,831
Purchase Details
Closed on
Apr 23, 1996
Sold by
Ipswich Est T
Bought by
Marrano Robert P and Marrano Elise
Home Financials for this Owner
Home Financials are based on the most recent Mortgage that was taken out on this home.
Original Mortgage
$260,000
Interest Rate
7.34%
Mortgage Type
Purchase Money Mortgage
Create a Home Valuation Report for This Property
The Home Valuation Report is an in-depth analysis detailing your home's value as well as a comparison with similar homes in the area
Home Values in the Area
Average Home Value in this Area
Purchase History
| Date | Buyer | Sale Price | Title Company |
|---|---|---|---|
| Monaco Elizabeth M | $780,000 | -- | |
| Marrano Robert P | $395,000 | -- |
Source: Public Records
Mortgage History
| Date | Status | Borrower | Loan Amount |
|---|---|---|---|
| Open | Monaco Elizabeth M | $523,750 | |
| Closed | Marrano Robert P | $100,250 | |
| Previous Owner | Marrano Robert P | $90,000 | |
| Previous Owner | Marrano Robert P | $260,000 |
Source: Public Records
Tax History
| Year | Tax Paid | Tax Assessment Tax Assessment Total Assessment is a certain percentage of the fair market value that is determined by local assessors to be the total taxable value of land and additions on the property. | Land | Improvement |
|---|---|---|---|---|
| 2025 | $8,366 | $966,100 | $228,800 | $737,300 |
| 2024 | $8,200 | $917,200 | $208,900 | $708,300 |
| 2023 | $8,235 | $876,100 | $181,100 | $695,000 |
| 2022 | $7,924 | $796,400 | $164,600 | $631,800 |
| 2021 | $8,577 | $788,500 | $156,700 | $631,800 |
| 2020 | $8,387 | $786,000 | $154,200 | $631,800 |
| 2019 | $1,628 | $713,400 | $144,200 | $569,200 |
| 2018 | $7,750 | $729,800 | $144,200 | $585,600 |
| 2017 | $7,682 | $694,600 | $130,600 | $564,000 |
| 2016 | $7,651 | $667,600 | $124,300 | $543,300 |
| 2015 | $7,577 | $667,600 | $124,300 | $543,300 |
| 2014 | $7,691 | $640,900 | $107,400 | $533,500 |
Source: Public Records
Map
Nearby Homes
- 59 Donald Rd
- 10 Lee Ave
- 14 Sarah St
- 12 Alcine Ln
- 4 Boutwell St
- 10 Stonehedge Dr
- 2 Stephanie St
- 44 Connolly Rd
- 20 Alma Rd
- 7 Avon St
- 6 Glade St
- 24 Lowell St
- 36 Middlesex Ave Unit 3
- 7 Cross St Unit 301
- 7 Cross St Unit 303
- 7 Cross St Unit 201
- 7 Cross St Unit 306
- 7 Cross St Unit 102
- 7 Cross St Unit 304
- 17 Glenvale Ave
Your Personal Tour Guide
Ask me questions while you tour the home.