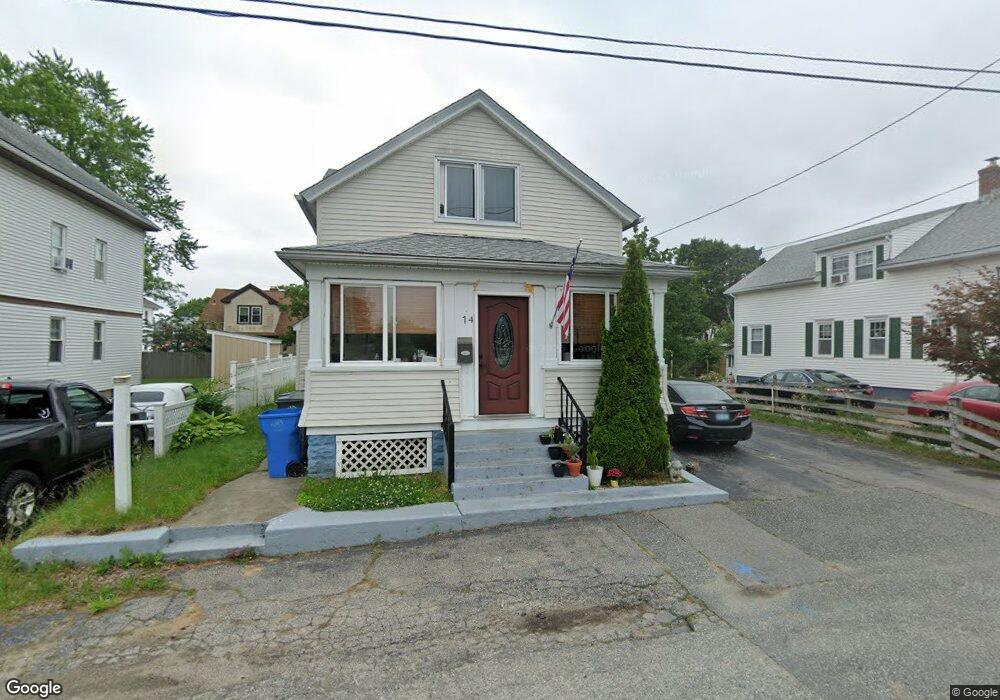
14 Molter St Cranston, RI 02910
Spectacle NeighborhoodEstimated Value: $353,000 - $416,000
3
Beds
2
Baths
1,300
Sq Ft
$295/Sq Ft
Est. Value
About This Home
This home is located at 14 Molter St, Cranston, RI 02910 and is currently estimated at $383,431, approximately $294 per square foot. 14 Molter St is a home located in Providence County with nearby schools including Stadium Elementary School, Hugh B. Bain Middle School, and Cranston High School East.
Ownership History
Date
Name
Owned For
Owner Type
Purchase Details
Closed on
Oct 4, 2010
Sold by
Petersen Cheryl
Bought by
Muth Peek
Current Estimated Value
Home Financials for this Owner
Home Financials are based on the most recent Mortgage that was taken out on this home.
Original Mortgage
$93,190
Outstanding Balance
$61,295
Interest Rate
4.44%
Mortgage Type
Purchase Money Mortgage
Estimated Equity
$322,136
Purchase Details
Closed on
Sep 28, 1998
Sold by
Voccio Ferentina M and Voccio Frank D
Bought by
Petersen Glenn and Petersen Cheryl
Home Financials for this Owner
Home Financials are based on the most recent Mortgage that was taken out on this home.
Original Mortgage
$78,750
Interest Rate
6.87%
Create a Home Valuation Report for This Property
The Home Valuation Report is an in-depth analysis detailing your home's value as well as a comparison with similar homes in the area
Home Values in the Area
Average Home Value in this Area
Purchase History
| Date | Buyer | Sale Price | Title Company |
|---|---|---|---|
| Muth Peek | $98,000 | -- | |
| Petersen Glenn | $80,000 | -- |
Source: Public Records
Mortgage History
| Date | Status | Borrower | Loan Amount |
|---|---|---|---|
| Open | Petersen Glenn | $93,190 | |
| Previous Owner | Petersen Glenn | $78,750 |
Source: Public Records
Tax History
| Year | Tax Paid | Tax Assessment Tax Assessment Total Assessment is a certain percentage of the fair market value that is determined by local assessors to be the total taxable value of land and additions on the property. | Land | Improvement |
|---|---|---|---|---|
| 2025 | $3,495 | $251,800 | $97,200 | $154,600 |
| 2024 | $3,427 | $251,800 | $97,200 | $154,600 |
| 2023 | $3,410 | $180,400 | $67,000 | $113,400 |
| 2022 | $3,339 | $180,400 | $67,000 | $113,400 |
| 2021 | $3,247 | $180,400 | $67,000 | $113,400 |
| 2020 | $3,186 | $153,400 | $63,700 | $89,700 |
| 2019 | $3,186 | $153,400 | $63,700 | $89,700 |
| 2018 | $3,112 | $153,400 | $63,700 | $89,700 |
| 2017 | $2,792 | $121,700 | $46,900 | $74,800 |
| 2016 | $2,732 | $121,700 | $46,900 | $74,800 |
| 2015 | $2,732 | $121,700 | $46,900 | $74,800 |
| 2014 | $2,780 | $121,700 | $46,900 | $74,800 |
Source: Public Records
Map
Nearby Homes
Your Personal Tour Guide
Ask me questions while you tour the home.