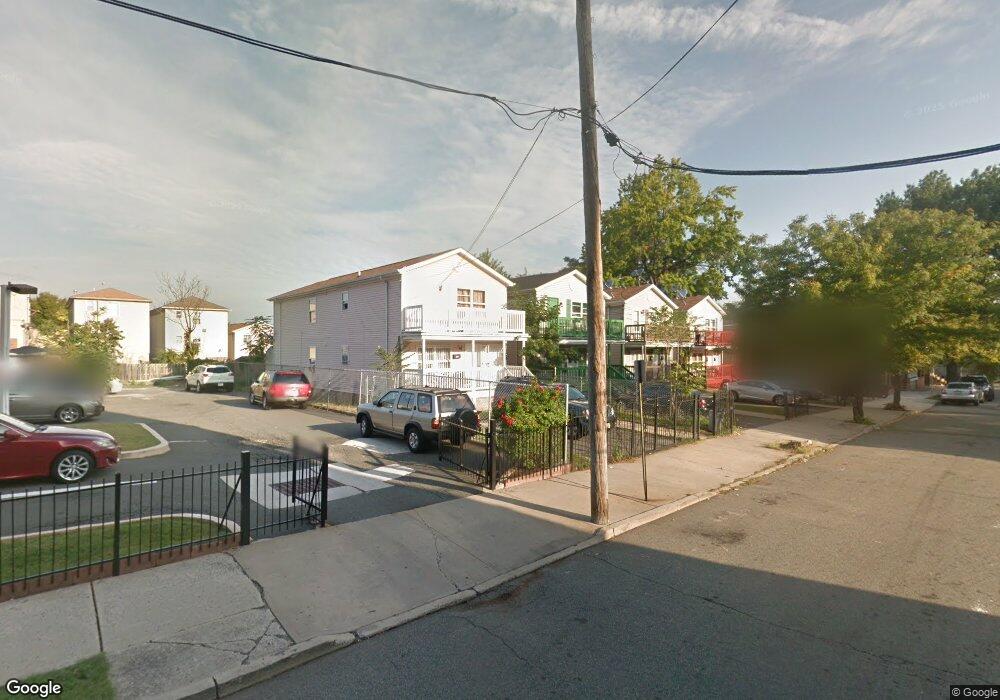
14 N 11th St Newark, NJ 07107
Lower Roseville NeighborhoodEstimated Value: $505,311 - $603,000
Studio
--
Bath
2,080
Sq Ft
$272/Sq Ft
Est. Value
About This Home
This home is located at 14 N 11th St, Newark, NJ 07107 and is currently estimated at $565,328, approximately $271 per square foot. 14 N 11th St is a home located in Essex County with nearby schools including Dr. William H. Horton School, Franklin School, and First Avenue Elementary School.
Ownership History
Date
Name
Owned For
Owner Type
Purchase Details
Closed on
Oct 10, 2006
Current Estimated Value
Purchase Details
Closed on
Mar 4, 1999
Sold by
Walker Marl L
Bought by
Golden Felilcia
Purchase Details
Closed on
Mar 17, 1994
Sold by
Afforadable Jp
Bought by
Walker Darry
Home Financials for this Owner
Home Financials are based on the most recent Mortgage that was taken out on this home.
Original Mortgage
$73,000
Interest Rate
7.15%
Create a Home Valuation Report for This Property
The Home Valuation Report is an in-depth analysis detailing your home's value as well as a comparison with similar homes in the area
Home Values in the Area
Average Home Value in this Area
Purchase History
| Date | Buyer | Sale Price | Title Company |
|---|---|---|---|
| -- | -- | -- | |
| Golden Felilcia | $92,500 | -- | |
| Walker Darry | $76,900 | -- |
Source: Public Records
Mortgage History
| Date | Status | Borrower | Loan Amount |
|---|---|---|---|
| Previous Owner | Walker Darry | $73,000 |
Source: Public Records
Tax History
| Year | Tax Paid | Tax Assessment Tax Assessment Total Assessment is a certain percentage of the fair market value that is determined by local assessors to be the total taxable value of land and additions on the property. | Land | Improvement |
|---|---|---|---|---|
| 2025 | $5,715 | $153,300 | $24,100 | $129,200 |
| 2024 | $5,715 | $153,300 | $24,100 | $129,200 |
| 2022 | $5,727 | $153,300 | $24,100 | $129,200 |
| 2021 | $5,724 | $153,300 | $24,100 | $129,200 |
| 2020 | $5,825 | $153,300 | $24,100 | $129,200 |
| 2019 | $5,766 | $153,300 | $24,100 | $129,200 |
| 2018 | $5,661 | $153,300 | $24,100 | $129,200 |
| 2017 | $5,457 | $153,300 | $24,100 | $129,200 |
| 2016 | $5,274 | $153,300 | $24,100 | $129,200 |
| 2015 | $5,073 | $153,300 | $24,100 | $129,200 |
| 2014 | $4,754 | $153,300 | $24,100 | $129,200 |
Source: Public Records
Map
Nearby Homes
- 437-439 W 7th Ave Unit 4
- 437 7th Ave W Unit 439
- 126 N 14th St
- 160-162 Roseville Ave Unit 3
- 160-162 Roseville Ave
- 18 William St Unit A
- 109 S 7th St Unit 111
- 108 N 13th St
- 109 N 7th St
- 119 N 14th St
- 116 N 13th St
- 118 N 13th St
- 102 S 14th St
- 134 N 14th St
- 131 N 14th St
- 57 N 7th St
- 213 N 7th St
- 267 6th Ave W
- 133 N 15th St Unit 2
- 133 N 15th St