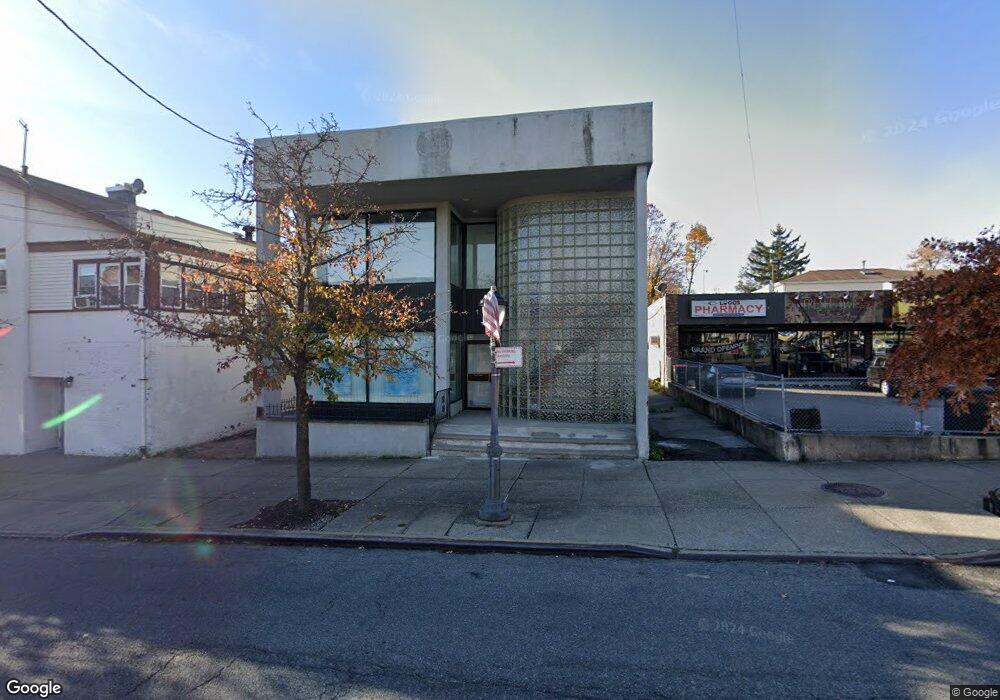
14 New Dorp Ln Staten Island, NY 10306
New Dorp NeighborhoodEstimated Value: $736,136
--
Bed
--
Bath
4,200
Sq Ft
$175/Sq Ft
Est. Value
About This Home
This home is located at 14 New Dorp Ln, Staten Island, NY 10306 and is currently estimated at $736,136, approximately $175 per square foot. 14 New Dorp Ln is a home located in Richmond County with nearby schools including P.S. 41 The Stephanie a Vierno School, Is 2 George L Egbert, and New Dorp High School.
Ownership History
Date
Name
Owned For
Owner Type
Purchase Details
Closed on
Mar 14, 2024
Sold by
Oh Brother Llc
Bought by
R2s Management Llc
Current Estimated Value
Purchase Details
Closed on
Aug 29, 2002
Sold by
Rudder Brian and Rudder Sheila B
Bought by
Ohbrother Llc
Home Financials for this Owner
Home Financials are based on the most recent Mortgage that was taken out on this home.
Original Mortgage
$380,000
Interest Rate
6.48%
Mortgage Type
Commercial
Create a Home Valuation Report for This Property
The Home Valuation Report is an in-depth analysis detailing your home's value as well as a comparison with similar homes in the area
Home Values in the Area
Average Home Value in this Area
Purchase History
| Date | Buyer | Sale Price | Title Company |
|---|---|---|---|
| R2s Management Llc | $710,000 | Kct Abstract Professional Titl | |
| Ohbrother Llc | $750,000 | Chicago Title Insurance Co |
Source: Public Records
Mortgage History
| Date | Status | Borrower | Loan Amount |
|---|---|---|---|
| Previous Owner | Ohbrother Llc | $380,000 |
Source: Public Records
Tax History Compared to Growth
Tax History
| Year | Tax Paid | Tax Assessment Tax Assessment Total Assessment is a certain percentage of the fair market value that is determined by local assessors to be the total taxable value of land and additions on the property. | Land | Improvement |
|---|---|---|---|---|
| 2025 | $25,205 | $261,900 | $86,400 | $175,500 |
| 2024 | $25,205 | $279,000 | $86,400 | $192,600 |
| 2023 | $24,366 | $228,870 | $86,400 | $142,470 |
| 2022 | $24,431 | $229,950 | $86,400 | $143,550 |
| 2021 | $21,367 | $199,800 | $86,400 | $113,400 |
| 2020 | $61,756 | $240,300 | $86,400 | $153,900 |
| 2019 | $70,071 | $233,550 | $86,400 | $147,150 |
| 2018 | $23,501 | $232,200 | $86,400 | $145,800 |
| 2017 | $21,452 | $226,800 | $86,400 | $140,400 |
| 2016 | $20,470 | $225,450 | $86,400 | $139,050 |
| 2015 | $18,210 | $216,900 | $86,400 | $130,500 |
| 2014 | $18,210 | $176,400 | $49,950 | $126,450 |
Source: Public Records
Map
Nearby Homes