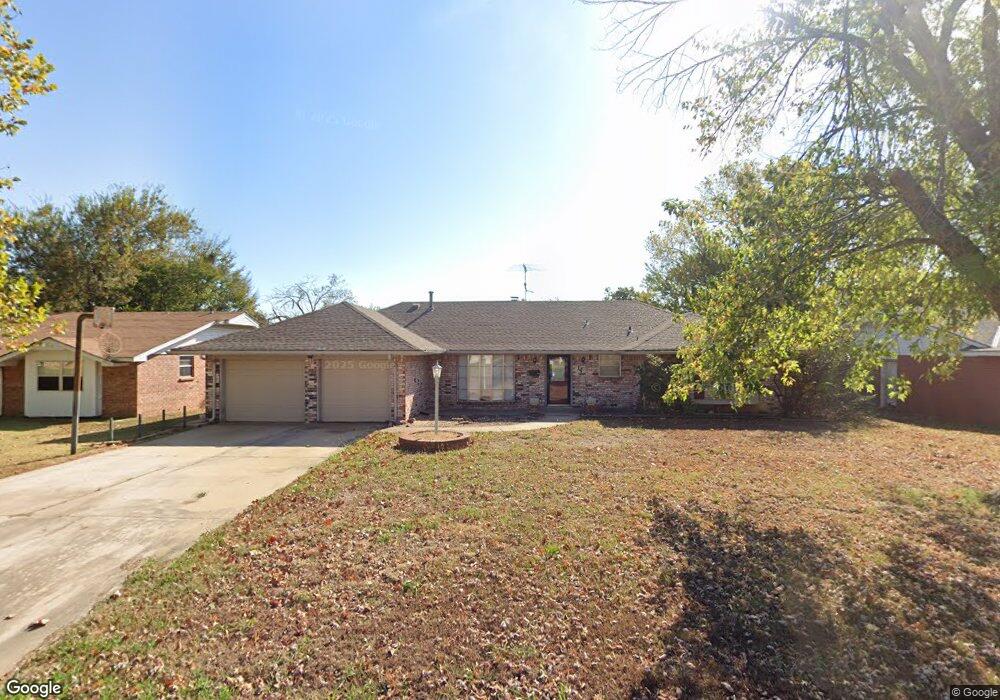
14 Osage Shawnee, OK 74801
Estimated Value: $178,357 - $226,000
3
Beds
2
Baths
1,725
Sq Ft
$115/Sq Ft
Est. Value
About This Home
This home is located at 14 Osage, Shawnee, OK 74801 and is currently estimated at $198,839, approximately $115 per square foot. 14 Osage is a home located in Pottawatomie County with nearby schools including Sequoyah Elementary School, Shawnee Middle School, and Shawnee High School.
Ownership History
Date
Name
Owned For
Owner Type
Purchase Details
Closed on
May 13, 2011
Sold by
Mitchell Kenneth and Mitchell Ray Jean
Bought by
Sternweis John A and Sternweis Lisa Mcalister
Current Estimated Value
Home Financials for this Owner
Home Financials are based on the most recent Mortgage that was taken out on this home.
Original Mortgage
$80,000
Outstanding Balance
$55,175
Interest Rate
4.87%
Mortgage Type
New Conventional
Estimated Equity
$143,664
Purchase Details
Closed on
Dec 7, 2007
Sold by
Banning Roger L and Banning Beverly Y
Bought by
Mitchell Kenneth and Mitchell Ray Jean
Home Financials for this Owner
Home Financials are based on the most recent Mortgage that was taken out on this home.
Original Mortgage
$90,000
Interest Rate
6.4%
Mortgage Type
Unknown
Purchase Details
Closed on
May 25, 1995
Sold by
Perry William and Perry Louise F
Bought by
Banning Roger and Banning Beverly
Create a Home Valuation Report for This Property
The Home Valuation Report is an in-depth analysis detailing your home's value as well as a comparison with similar homes in the area
Purchase History
| Date | Buyer | Sale Price | Title Company |
|---|---|---|---|
| Sternweis John A | $131,000 | None Available | |
| Mitchell Kenneth | $125,000 | None Available | |
| Banning Roger | $70,000 | -- |
Source: Public Records
Mortgage History
| Date | Status | Borrower | Loan Amount |
|---|---|---|---|
| Open | Sternweis John A | $80,000 | |
| Previous Owner | Mitchell Kenneth | $90,000 |
Source: Public Records
Tax History
| Year | Tax Paid | Tax Assessment Tax Assessment Total Assessment is a certain percentage of the fair market value that is determined by local assessors to be the total taxable value of land and additions on the property. | Land | Improvement |
|---|---|---|---|---|
| 2025 | $1,991 | $20,290 | $1,764 | $18,526 |
| 2023 | $1,923 | $18,403 | $1,764 | $16,639 |
| 2022 | $1,888 | $18,403 | $1,764 | $16,639 |
| 2021 | $1,854 | $18,403 | $1,764 | $16,639 |
| 2020 | $1,885 | $18,653 | $1,764 | $16,889 |
| 2019 | $1,999 | $19,148 | $1,764 | $17,384 |
| 2018 | $2,010 | $19,641 | $1,764 | $17,877 |
| 2017 | $1,921 | $19,040 | $1,668 | $17,372 |
| 2016 | $1,850 | $18,134 | $1,588 | $16,546 |
| 2015 | $1,727 | $17,270 | $1,572 | $15,698 |
| 2014 | $1,645 | $16,447 | $1,429 | $15,018 |
Source: Public Records
Map
Nearby Homes
- 17 Mojave Dr
- 7 Kiowa
- 5 Larkins Place
- 17 Sequoyah Blvd
- 19 Cheyenne Dr
- 1307 Laverne Ave
- 1233 Sherry Ln
- 32 Comanche Dr
- 1404 Charles Dr
- 1301 Rickey Rd
- 30 Seneca Dr
- 9 Dustin Cir
- 1725 E Dougherty Dr
- 1262 Augusta Ct
- 1181 Augusta Ct
- 1202 Mark St
- 1836 N Bryan Ave
- 1306 E Wallace St
- 1211 Rose Dr
- 1206 Monroe Dr
Your Personal Tour Guide
Ask me questions while you tour the home.