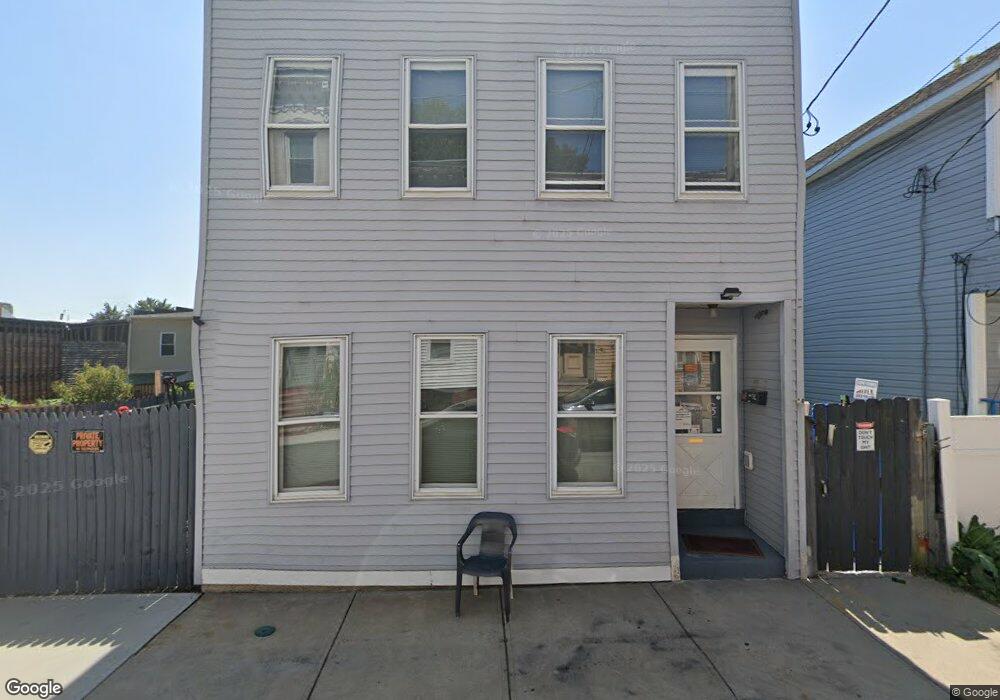
14 Osborne St Albany, NY 12202
South End NeighborhoodEstimated Value: $147,000 - $190,500
3
Beds
1
Bath
1,400
Sq Ft
$118/Sq Ft
Est. Value
About This Home
This home is located at 14 Osborne St, Albany, NY 12202 and is currently estimated at $165,875, approximately $118 per square foot. 14 Osborne St is a home located in Albany County with nearby schools including Giffen Memorial Elementary School, Stephen And Harriet Myers Middle School, and Albany High School.
Ownership History
Date
Name
Owned For
Owner Type
Purchase Details
Closed on
Mar 5, 1999
Sold by
Capital District Habitat For H
Bought by
Brown Francine
Current Estimated Value
Home Financials for this Owner
Home Financials are based on the most recent Mortgage that was taken out on this home.
Original Mortgage
$51,000
Interest Rate
6.78%
Purchase Details
Closed on
Jun 10, 1996
Sold by
Rosen Elliott Jay
Bought by
Capital Distrist Habitat
Create a Home Valuation Report for This Property
The Home Valuation Report is an in-depth analysis detailing your home's value as well as a comparison with similar homes in the area
Home Values in the Area
Average Home Value in this Area
Purchase History
| Date | Buyer | Sale Price | Title Company |
|---|---|---|---|
| Brown Francine | $71,000 | -- | |
| Brown Francine | $72,250 | -- | |
| Capital Distrist Habitat | $100 | -- |
Source: Public Records
Mortgage History
| Date | Status | Borrower | Loan Amount |
|---|---|---|---|
| Closed | Brown Francine | $51,000 |
Source: Public Records
Tax History Compared to Growth
Tax History
| Year | Tax Paid | Tax Assessment Tax Assessment Total Assessment is a certain percentage of the fair market value that is determined by local assessors to be the total taxable value of land and additions on the property. | Land | Improvement |
|---|---|---|---|---|
| 2024 | $2,969 | $131,000 | $26,200 | $104,800 |
| 2023 | $3,822 | $108,000 | $21,600 | $86,400 |
| 2022 | $3,662 | $108,000 | $21,600 | $86,400 |
| 2021 | $3,628 | $108,000 | $21,600 | $86,400 |
| 2020 | $3,460 | $108,000 | $21,600 | $86,400 |
| 2019 | $4,252 | $108,000 | $21,600 | $86,400 |
| 2018 | $3,457 | $108,000 | $21,600 | $86,400 |
| 2017 | $1,791 | $108,000 | $21,600 | $86,400 |
| 2016 | $3,359 | $108,000 | $21,600 | $86,400 |
| 2015 | $3,297 | $107,400 | $21,500 | $85,900 |
| 2014 | -- | $107,400 | $21,500 | $85,900 |
Source: Public Records
Map
Nearby Homes