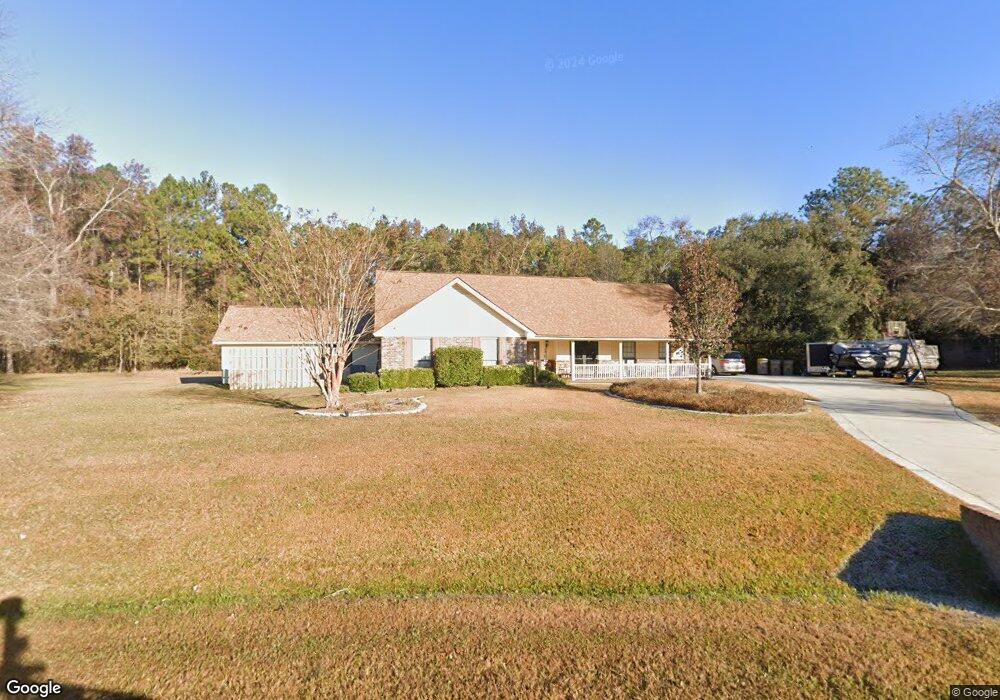
14 Paddleford Ct Rincon, GA 31326
Estimated Value: $345,714 - $404,000
Studio
1
Bath
1,965
Sq Ft
$188/Sq Ft
Est. Value
About This Home
This home is located at 14 Paddleford Ct, Rincon, GA 31326 and is currently estimated at $369,929, approximately $188 per square foot. 14 Paddleford Ct is a home located in Effingham County with nearby schools including South Effingham Elementary School, South Effingham Middle School, and South Effingham High School.
Ownership History
Date
Name
Owned For
Owner Type
Purchase Details
Closed on
Jun 2, 2022
Sold by
Burchette Richard C Executor
Bought by
Newton Joseph Randall and Newton Megan
Current Estimated Value
Home Financials for this Owner
Home Financials are based on the most recent Mortgage that was taken out on this home.
Original Mortgage
$282,000
Outstanding Balance
$267,172
Interest Rate
5.27%
Mortgage Type
VA
Estimated Equity
$102,757
Purchase Details
Closed on
May 7, 1992
Bought by
Burchette Richard C
Create a Home Valuation Report for This Property
The Home Valuation Report is an in-depth analysis detailing your home's value as well as a comparison with similar homes in the area
Home Values in the Area
Average Home Value in this Area
Purchase History
| Date | Buyer | Sale Price | Title Company |
|---|---|---|---|
| Newton Joseph Randall | $282,000 | -- | |
| Burchette Richard C | $102,000 | -- |
Source: Public Records
Mortgage History
| Date | Status | Borrower | Loan Amount |
|---|---|---|---|
| Open | Newton Joseph Randall | $282,000 |
Source: Public Records
Tax History
| Year | Tax Paid | Tax Assessment Tax Assessment Total Assessment is a certain percentage of the fair market value that is determined by local assessors to be the total taxable value of land and additions on the property. | Land | Improvement |
|---|---|---|---|---|
| 2025 | $533 | $140,294 | $22,800 | $117,494 |
| 2024 | $472 | $134,486 | $22,800 | $111,686 |
| 2023 | $402 | $110,099 | $18,800 | $91,299 |
| 2022 | $115 | $96,224 | $16,000 | $80,224 |
| 2021 | $2,513 | $78,003 | $14,000 | $64,003 |
| 2020 | $2,470 | $77,428 | $14,000 | $63,428 |
| 2019 | $2,342 | $72,563 | $14,000 | $58,563 |
| 2018 | $2,463 | $75,678 | $14,000 | $61,678 |
| 2017 | $2,416 | $73,427 | $14,000 | $59,427 |
| 2016 | $2,340 | $74,464 | $16,800 | $57,664 |
| 2015 | -- | $69,664 | $12,000 | $57,664 |
| 2014 | -- | $67,664 | $10,000 | $57,664 |
| 2013 | -- | $67,614 | $10,000 | $57,614 |
Source: Public Records
Map
Nearby Homes
- 1 Hampton Ct
- 126 Fraser Ln
- 101 Monterey Dr
- 139 Fraser Ln
- 141 Fraser Ln
- 124 Oak St
- 5033 Mccall Rd
- 5323 Mccall Rd
- 204 Whitehall Ave
- 138 John Glenn Dr
- 127 Crystal Dr
- 121 Crystal Dr
- 125 Westwood Dr
- 127 John Glenn Dr
- 117 Whitehall Ave
- 119 Mulberry Way
- 100 Usher Place
- 110 Katie Dr
- 107 Melrose Place
- 5475 Mccall Rd
- 12 Paddleford Ct
- 16 Paddleford Ct
- 3 Paddleford Ct
- 10 Paddleford Ct
- 2 Hampton Ct
- 5 Paddleford Ct
- 129 Oak St
- 8 Paddleford Ct
- 4 Hampton Ct
- 6 Paddleford Ct
- 1 Hampton Ct Unit 52
- 6 Hampton Ct
- 3 Hampton Ct
- 4 Paddleford Ct
- 1 Paddleford Ct
- 5 Hampton Ct
- 126 Oak St
- 127 Oak St
- 143 Paddleford Dr
- 141 Paddleford Dr
Your Personal Tour Guide
Ask me questions while you tour the home.