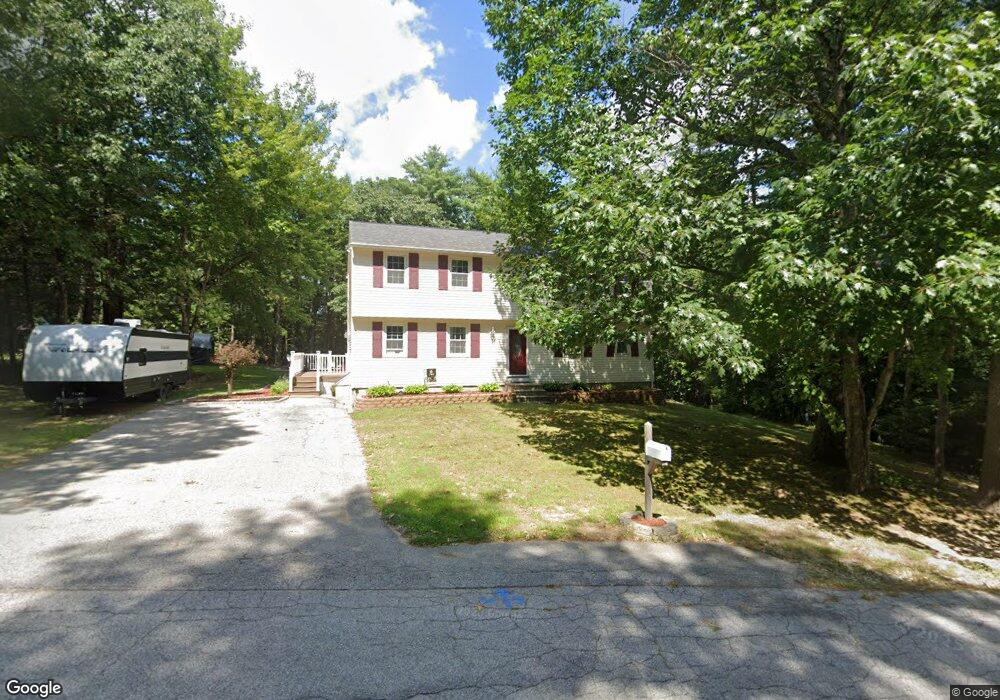
14 Pierce Rd Raymond, NH 03077
Estimated Value: $500,000 - $554,000
4
Beds
1
Bath
2,300
Sq Ft
$230/Sq Ft
Est. Value
About This Home
This home is located at 14 Pierce Rd, Raymond, NH 03077 and is currently estimated at $529,736, approximately $230 per square foot. 14 Pierce Rd is a home located in Rockingham County with nearby schools including Lamprey River Elementary School, Iber Holmes Gove Middle School, and Raymond High School.
Ownership History
Date
Name
Owned For
Owner Type
Purchase Details
Closed on
Dec 17, 2008
Sold by
Northeast Cu
Bought by
Normandin Justin Michael and Normandin Heather
Current Estimated Value
Home Financials for this Owner
Home Financials are based on the most recent Mortgage that was taken out on this home.
Original Mortgage
$190,000
Interest Rate
6.27%
Mortgage Type
VA
Purchase Details
Closed on
Jul 15, 2008
Sold by
Cronan Donald J
Bought by
Northeast Cu
Create a Home Valuation Report for This Property
The Home Valuation Report is an in-depth analysis detailing your home's value as well as a comparison with similar homes in the area
Home Values in the Area
Average Home Value in this Area
Purchase History
| Date | Buyer | Sale Price | Title Company |
|---|---|---|---|
| Normandin Justin Michael | $190,000 | -- | |
| Northeast Cu | $197,600 | -- |
Source: Public Records
Mortgage History
| Date | Status | Borrower | Loan Amount |
|---|---|---|---|
| Open | Northeast Cu | $188,786 | |
| Closed | Northeast Cu | $190,000 | |
| Previous Owner | Northeast Cu | $255,000 | |
| Previous Owner | Northeast Cu | $202,500 |
Source: Public Records
Tax History Compared to Growth
Tax History
| Year | Tax Paid | Tax Assessment Tax Assessment Total Assessment is a certain percentage of the fair market value that is determined by local assessors to be the total taxable value of land and additions on the property. | Land | Improvement |
|---|---|---|---|---|
| 2024 | $7,171 | $327,300 | $118,000 | $209,300 |
| 2023 | $6,782 | $327,300 | $118,000 | $209,300 |
| 2022 | $5,986 | $327,300 | $118,000 | $209,300 |
| 2021 | $6,058 | $327,300 | $118,000 | $209,300 |
| 2020 | $6,228 | $237,700 | $84,500 | $153,200 |
| 2019 | $6,320 | $237,700 | $84,500 | $153,200 |
| 2018 | $6,263 | $237,700 | $84,500 | $153,200 |
| 2017 | $5,752 | $237,700 | $84,500 | $153,200 |
| 2016 | $5,643 | $237,700 | $84,500 | $153,200 |
| 2015 | $5,482 | $218,600 | $84,500 | $134,100 |
| 2014 | $5,319 | $218,600 | $84,500 | $134,100 |
| 2013 | $5,045 | $213,400 | $84,500 | $128,900 |
Source: Public Records
Map
Nearby Homes
- 0 Eastside Dr Unit 33
- 14 Mica Dr Unit 3
- 10 Mica Dr Unit 1
- 16 Mica Dr Unit 4
- 20 Mica Dr Unit 6
- 4 Coolidge Way
- 7 Moulton St
- 13 Autumn Ln
- 209 New Hampshire 27
- 3 Autumn Ln
- 17 Autumn Ln
- 18 Lilac Ct
- 17 Lilac Ct
- 9 Abbey Rd
- 91 Fremont Rd
- 11 Evelyn Ave
- 13 Debra Ave
- 47 Long Hill Rd
- 18 Nottingham Rd
- 39 Prescott Rd