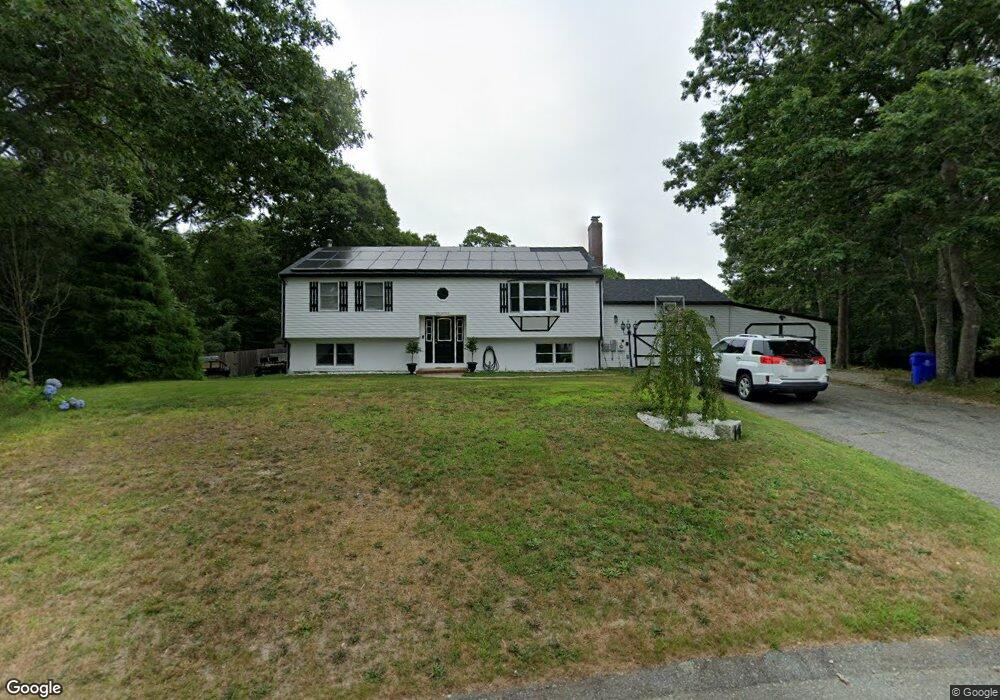
14 Pryer Dr Pocasset, MA 02559
Pocasset NeighborhoodEstimated Value: $605,000 - $713,000
4
Beds
2
Baths
1,501
Sq Ft
$441/Sq Ft
Est. Value
About This Home
This home is located at 14 Pryer Dr, Pocasset, MA 02559 and is currently estimated at $662,215, approximately $441 per square foot. 14 Pryer Dr is a home located in Barnstable County with nearby schools including Bourne High School, Cadence Academy Preschool - Bourne, and St Margaret Regional School.
Ownership History
Date
Name
Owned For
Owner Type
Purchase Details
Closed on
Aug 31, 2004
Sold by
Bradbury Dorothy G and Bradbury James H
Bought by
Ballard 3Rd Carl H and Ballard Patricia M
Current Estimated Value
Home Financials for this Owner
Home Financials are based on the most recent Mortgage that was taken out on this home.
Original Mortgage
$259,050
Outstanding Balance
$127,719
Interest Rate
6.02%
Mortgage Type
Purchase Money Mortgage
Estimated Equity
$534,496
Purchase Details
Closed on
Aug 25, 1989
Sold by
Hampson Frank R
Bought by
Bradbury James H
Create a Home Valuation Report for This Property
The Home Valuation Report is an in-depth analysis detailing your home's value as well as a comparison with similar homes in the area
Home Values in the Area
Average Home Value in this Area
Purchase History
| Date | Buyer | Sale Price | Title Company |
|---|---|---|---|
| Ballard 3Rd Carl H | $330,000 | -- | |
| Ballard 3Rd Carl H | $330,000 | -- | |
| Bradbury James H | $165,000 | -- | |
| Bradbury James H | $165,000 | -- |
Source: Public Records
Mortgage History
| Date | Status | Borrower | Loan Amount |
|---|---|---|---|
| Open | Ballard 3Rd Carl H | $259,050 | |
| Closed | Bradbury James H | $259,050 |
Source: Public Records
Tax History Compared to Growth
Tax History
| Year | Tax Paid | Tax Assessment Tax Assessment Total Assessment is a certain percentage of the fair market value that is determined by local assessors to be the total taxable value of land and additions on the property. | Land | Improvement |
|---|---|---|---|---|
| 2025 | $4,198 | $537,500 | $210,700 | $326,800 |
| 2024 | $4,105 | $511,900 | $200,700 | $311,200 |
| 2023 | $4,000 | $454,000 | $177,600 | $276,400 |
| 2022 | $3,815 | $378,100 | $157,200 | $220,900 |
| 2021 | $3,489 | $324,000 | $143,000 | $181,000 |
| 2020 | $3,391 | $315,700 | $141,700 | $174,000 |
| 2019 | $3,215 | $305,900 | $141,700 | $164,200 |
| 2018 | $3,150 | $298,900 | $134,900 | $164,000 |
| 2017 | $2,878 | $279,400 | $133,700 | $145,700 |
| 2016 | $2,741 | $269,800 | $127,000 | $142,800 |
| 2015 | $2,717 | $269,800 | $127,000 | $142,800 |
Source: Public Records
Map
Nearby Homes
- 7 Portside Dr
- 15 1st St
- 7 4th Ave
- 174 Barlows Landing Rd
- 709 County Rd
- 940 County Rd
- 39 Bennets Neck Dr
- 254 Barlows Landing Rd
- 515 County Rd
- 501 County Rd
- 16 Tara Terrace
- 93 Valley Bars Rd
- 30 Howard Ave
- 940 County Rd
- 112 Clay Pond Rd
- 105 Clay Pond Rd
- 14 Navajo Rd
- 440 County Rd
- 2 Westerly Dr
- 566 Shore Rd