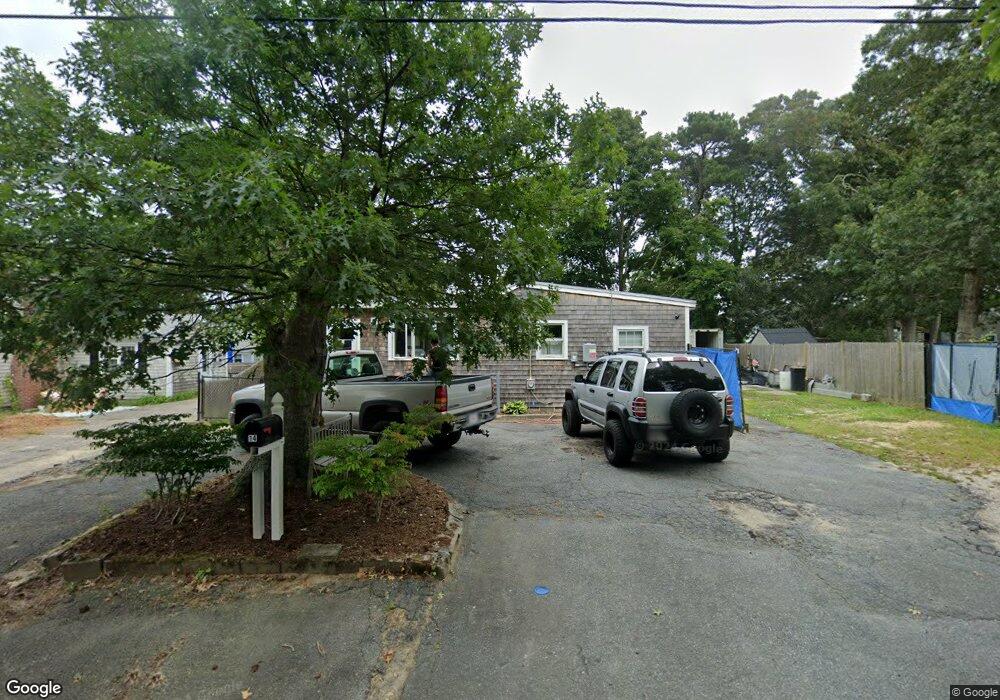
14 Rose Rd South Yarmouth, MA 02664
Estimated Value: $317,000 - $573,000
1
Bed
2
Baths
922
Sq Ft
$482/Sq Ft
Est. Value
About This Home
This home is located at 14 Rose Rd, South Yarmouth, MA 02664 and is currently estimated at $444,656, approximately $482 per square foot. 14 Rose Rd is a home located in Barnstable County with nearby schools including Dennis-Yarmouth Regional High School and St. Pius X. School.
Ownership History
Date
Name
Owned For
Owner Type
Purchase Details
Closed on
Aug 1, 2018
Sold by
Grignon Donald J Est
Bought by
Rivera-Negron Jacob
Current Estimated Value
Home Financials for this Owner
Home Financials are based on the most recent Mortgage that was taken out on this home.
Original Mortgage
$115,375
Outstanding Balance
$100,199
Interest Rate
4.5%
Mortgage Type
FHA
Estimated Equity
$344,457
Purchase Details
Closed on
Aug 31, 1964
Bought by
Grignon Donald J
Create a Home Valuation Report for This Property
The Home Valuation Report is an in-depth analysis detailing your home's value as well as a comparison with similar homes in the area
Home Values in the Area
Average Home Value in this Area
Purchase History
| Date | Buyer | Sale Price | Title Company |
|---|---|---|---|
| Rivera-Negron Jacob | $117,504 | -- | |
| Grignon Donald J | -- | -- |
Source: Public Records
Mortgage History
| Date | Status | Borrower | Loan Amount |
|---|---|---|---|
| Open | Rivera-Negron Jacob | $115,375 |
Source: Public Records
Tax History Compared to Growth
Tax History
| Year | Tax Paid | Tax Assessment Tax Assessment Total Assessment is a certain percentage of the fair market value that is determined by local assessors to be the total taxable value of land and additions on the property. | Land | Improvement |
|---|---|---|---|---|
| 2025 | $2,350 | $331,900 | $154,800 | $177,100 |
| 2024 | $2,165 | $293,400 | $130,800 | $162,600 |
| 2023 | $2,087 | $257,300 | $113,300 | $144,000 |
| 2022 | $2,324 | $253,200 | $103,000 | $150,200 |
| 2021 | $5,832 | $230,000 | $103,000 | $127,000 |
| 2020 | $2,193 | $219,300 | $103,000 | $116,300 |
| 2019 | $5,379 | $202,100 | $103,000 | $99,100 |
| 2018 | $1,922 | $186,800 | $87,700 | $99,100 |
| 2017 | $5,497 | $183,000 | $83,900 | $99,100 |
| 2016 | $1,750 | $175,400 | $76,300 | $99,100 |
| 2015 | $1,685 | $167,800 | $76,300 | $91,500 |
Source: Public Records
Map
Nearby Homes