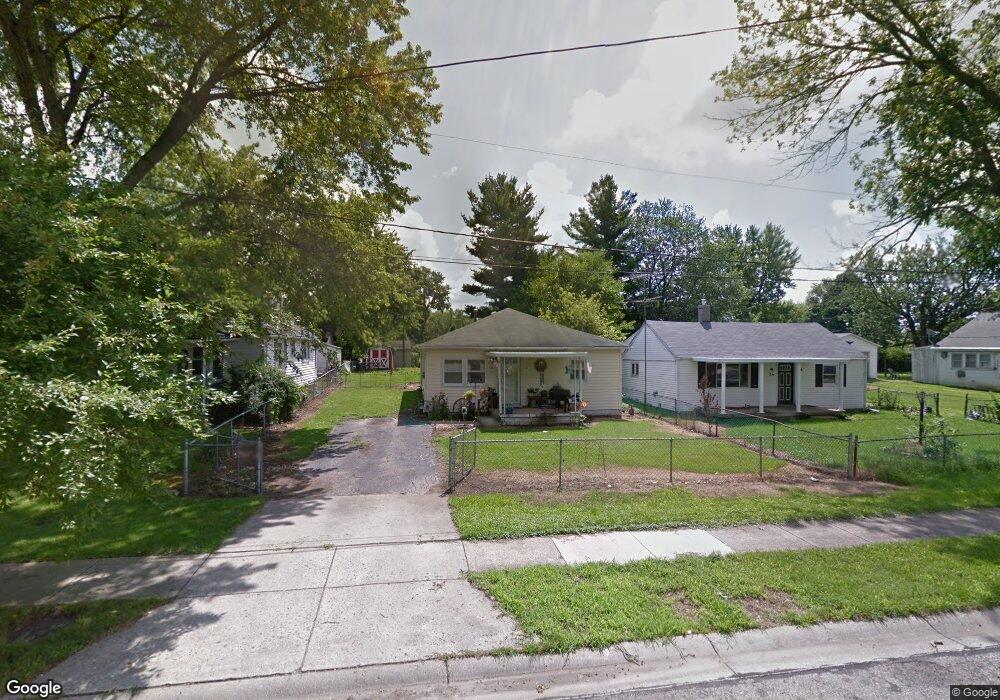
14 S Rankin St South Charleston, OH 45368
Estimated Value: $135,995 - $174,000
2
Beds
1
Bath
1,008
Sq Ft
$151/Sq Ft
Est. Value
About This Home
This home is located at 14 S Rankin St, South Charleston, OH 45368 and is currently estimated at $151,749, approximately $150 per square foot. 14 S Rankin St is a home located in Clark County with nearby schools including Miami View Elementary School and Southeastern Senior High School.
Ownership History
Date
Name
Owned For
Owner Type
Purchase Details
Closed on
Feb 28, 2022
Sold by
West Theresa A and West Larry
Bought by
Carey Allisyn Paige
Current Estimated Value
Home Financials for this Owner
Home Financials are based on the most recent Mortgage that was taken out on this home.
Original Mortgage
$134,242
Outstanding Balance
$125,425
Interest Rate
3.92%
Mortgage Type
New Conventional
Estimated Equity
$26,324
Purchase Details
Closed on
May 17, 2010
Sold by
Estate Of Carl E Kipp Jr
Bought by
Kipp Emma
Purchase Details
Closed on
Jul 27, 1992
Sold by
Knisley Ronald D and Knisley Kimberly S
Bought by
Kipp Carl E and Kipp Emma
Purchase Details
Closed on
May 8, 1989
Create a Home Valuation Report for This Property
The Home Valuation Report is an in-depth analysis detailing your home's value as well as a comparison with similar homes in the area
Home Values in the Area
Average Home Value in this Area
Purchase History
| Date | Buyer | Sale Price | Title Company |
|---|---|---|---|
| Carey Allisyn Paige | $132,900 | Midland Title West | |
| Kipp Emma | -- | None Available | |
| Kipp Carl E | $25,000 | -- | |
| -- | $38,000 | -- |
Source: Public Records
Mortgage History
| Date | Status | Borrower | Loan Amount |
|---|---|---|---|
| Open | Carey Allisyn Paige | $134,242 |
Source: Public Records
Tax History Compared to Growth
Tax History
| Year | Tax Paid | Tax Assessment Tax Assessment Total Assessment is a certain percentage of the fair market value that is determined by local assessors to be the total taxable value of land and additions on the property. | Land | Improvement |
|---|---|---|---|---|
| 2024 | $1,004 | $23,440 | $4,650 | $18,790 |
| 2023 | $1,004 | $23,440 | $4,650 | $18,790 |
| 2022 | $961 | $23,440 | $4,650 | $18,790 |
| 2021 | $819 | $17,890 | $3,550 | $14,340 |
| 2020 | $821 | $17,890 | $3,550 | $14,340 |
| 2019 | $808 | $17,890 | $3,550 | $14,340 |
| 2018 | $652 | $14,730 | $3,550 | $11,180 |
| 2017 | $650 | $14,728 | $3,549 | $11,179 |
| 2016 | $643 | $14,728 | $3,549 | $11,179 |
| 2015 | $636 | $14,179 | $3,549 | $10,630 |
| 2014 | $635 | $14,179 | $3,549 | $10,630 |
| 2013 | $636 | $14,179 | $3,549 | $10,630 |
Source: Public Records
Map
Nearby Homes