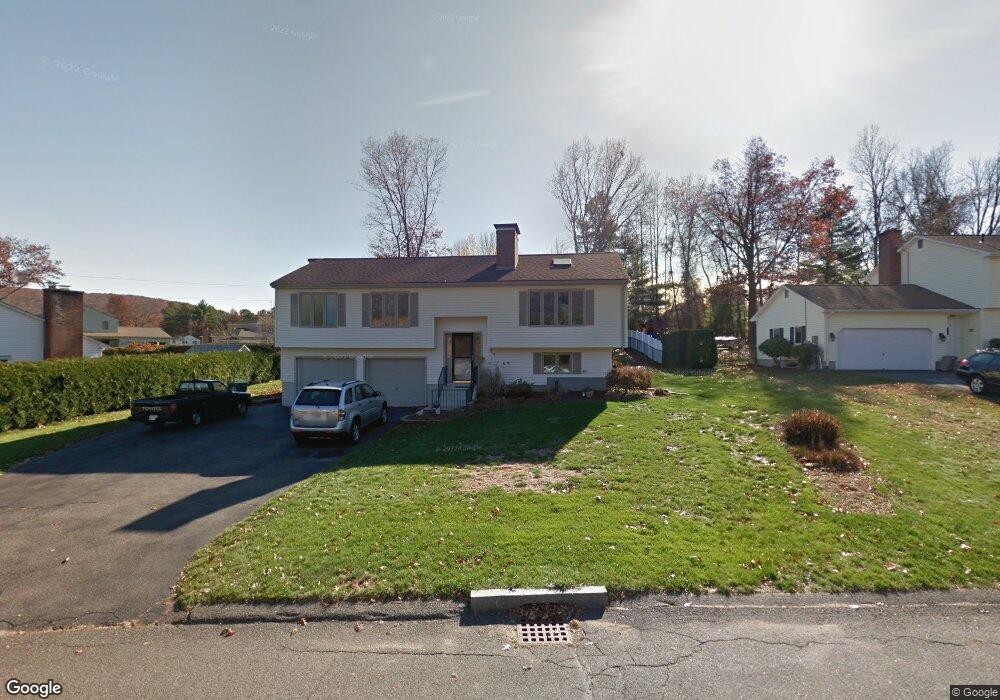
14 Silver Ln Easthampton, MA 01027
Estimated Value: $455,000 - $489,000
4
Beds
3
Baths
1,419
Sq Ft
$336/Sq Ft
Est. Value
About This Home
This home is located at 14 Silver Ln, Easthampton, MA 01027 and is currently estimated at $476,999, approximately $336 per square foot. 14 Silver Ln is a home located in Hampshire County with nearby schools including Easthampton High School, Calvary Baptist Christian School, and Tri-County Schools.
Ownership History
Date
Name
Owned For
Owner Type
Purchase Details
Closed on
Mar 14, 1994
Sold by
Lussier Melodie H and Lussier Eugene
Bought by
Mcmurphy Marcia E and Bassett Timothy
Current Estimated Value
Home Financials for this Owner
Home Financials are based on the most recent Mortgage that was taken out on this home.
Original Mortgage
$127,000
Interest Rate
6.93%
Mortgage Type
Purchase Money Mortgage
Create a Home Valuation Report for This Property
The Home Valuation Report is an in-depth analysis detailing your home's value as well as a comparison with similar homes in the area
Home Values in the Area
Average Home Value in this Area
Purchase History
| Date | Buyer | Sale Price | Title Company |
|---|---|---|---|
| Mcmurphy Marcia E | $142,000 | -- |
Source: Public Records
Mortgage History
| Date | Status | Borrower | Loan Amount |
|---|---|---|---|
| Open | Mcmurphy Marcia E | $30,000 | |
| Closed | Mcmurphy Marcia E | $127,000 | |
| Previous Owner | Mcmurphy Marcia E | $70,000 |
Source: Public Records
Tax History
| Year | Tax Paid | Tax Assessment Tax Assessment Total Assessment is a certain percentage of the fair market value that is determined by local assessors to be the total taxable value of land and additions on the property. | Land | Improvement |
|---|---|---|---|---|
| 2025 | $6,224 | $455,300 | $120,700 | $334,600 |
| 2024 | $6,004 | $442,800 | $117,200 | $325,600 |
| 2023 | $4,492 | $306,600 | $92,200 | $214,400 |
| 2022 | $5,068 | $306,600 | $92,200 | $214,400 |
| 2021 | $5,576 | $317,900 | $92,200 | $225,700 |
| 2020 | $5,445 | $306,600 | $92,200 | $214,400 |
| 2019 | $4,740 | $306,600 | $92,200 | $214,400 |
| 2018 | $4,490 | $280,600 | $86,900 | $193,700 |
| 2017 | $4,448 | $274,400 | $83,500 | $190,900 |
| 2016 | $4,278 | $274,400 | $83,500 | $190,900 |
| 2015 | $4,157 | $274,400 | $83,500 | $190,900 |
Source: Public Records
Map
Nearby Homes
Your Personal Tour Guide
Ask me questions while you tour the home.