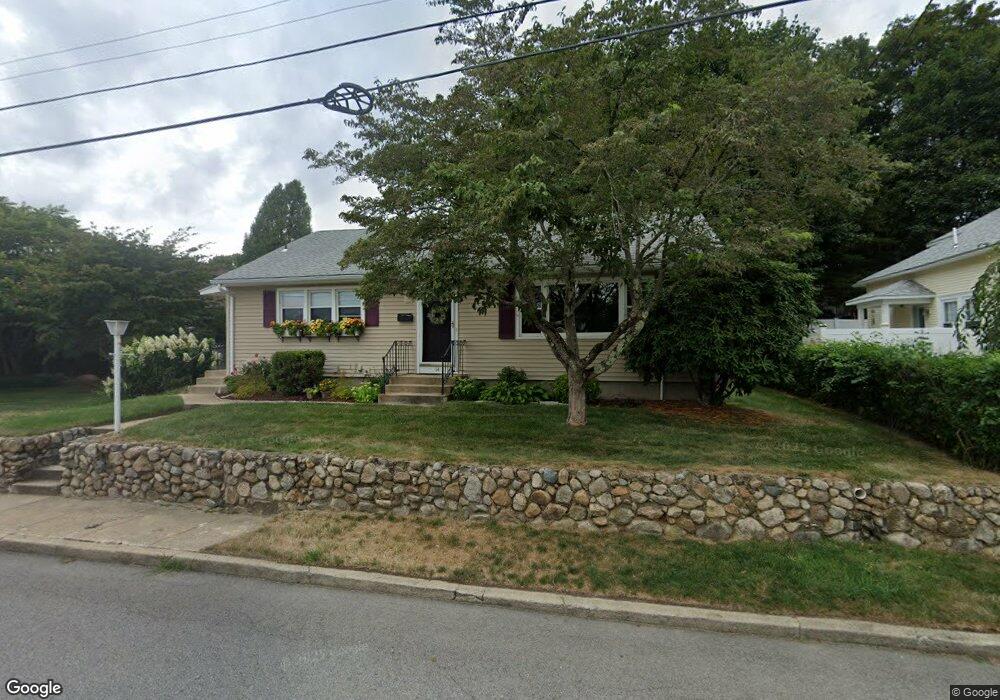
14 Standard Ave West Warwick, RI 02893
Centreville NeighborhoodEstimated Value: $384,000 - $423,000
3
Beds
1
Bath
1,176
Sq Ft
$336/Sq Ft
Est. Value
About This Home
This home is located at 14 Standard Ave, West Warwick, RI 02893 and is currently estimated at $394,933, approximately $335 per square foot. 14 Standard Ave is a home located in Kent County with nearby schools including West Warwick High School.
Ownership History
Date
Name
Owned For
Owner Type
Purchase Details
Closed on
Mar 26, 2008
Sold by
Lasalle Bk
Bought by
Henry Kimberly A
Current Estimated Value
Home Financials for this Owner
Home Financials are based on the most recent Mortgage that was taken out on this home.
Original Mortgage
$155,000
Interest Rate
5.76%
Mortgage Type
Purchase Money Mortgage
Purchase Details
Closed on
Dec 16, 2005
Sold by
Gagnon Lorraine Est
Bought by
Pinto David T and Pinto Jamie L
Create a Home Valuation Report for This Property
The Home Valuation Report is an in-depth analysis detailing your home's value as well as a comparison with similar homes in the area
Home Values in the Area
Average Home Value in this Area
Purchase History
| Date | Buyer | Sale Price | Title Company |
|---|---|---|---|
| Henry Kimberly A | $165,000 | -- | |
| Pinto David T | $222,000 | -- |
Source: Public Records
Mortgage History
| Date | Status | Borrower | Loan Amount |
|---|---|---|---|
| Open | Pinto David T | $158,400 | |
| Closed | Pinto David T | $155,000 | |
| Previous Owner | Pinto David T | $18,300 |
Source: Public Records
Tax History
| Year | Tax Paid | Tax Assessment Tax Assessment Total Assessment is a certain percentage of the fair market value that is determined by local assessors to be the total taxable value of land and additions on the property. | Land | Improvement |
|---|---|---|---|---|
| 2025 | $5,394 | $377,500 | $109,100 | $268,400 |
| 2024 | $5,058 | $270,600 | $70,100 | $200,500 |
| 2023 | $4,957 | $270,600 | $70,100 | $200,500 |
| 2022 | $4,882 | $270,600 | $70,100 | $200,500 |
| 2021 | $4,556 | $198,100 | $55,000 | $143,100 |
| 2020 | $4,556 | $198,100 | $55,000 | $143,100 |
| 2019 | $5,808 | $198,100 | $55,000 | $143,100 |
| 2018 | $4,028 | $148,200 | $50,300 | $97,900 |
| 2017 | $3,899 | $148,200 | $50,300 | $97,900 |
| 2016 | $3,829 | $148,200 | $50,300 | $97,900 |
| 2015 | $3,759 | $144,800 | $50,300 | $94,500 |
| 2014 | $919 | $144,800 | $50,300 | $94,500 |
Source: Public Records
Map
Nearby Homes
- 325 Washington St Unit 3
- 2 Ritchotte Ct
- 1 Ritchotte Ct
- 41 Pawtuxet Terrace
- 15 Hope Ct
- 176 Archambault Ave
- 40 Roberts St
- 40 Bassett St
- 58 Read Ave
- 54 Arthur St
- 420 Washington St
- 87 Bates Ave
- 38 New London Ave
- 22 Wood St
- 11 Wood St
- 10 Grove St
- 2 Duke St Unit D
- 131 Pawtuxet Terrace
- 25 Eddy St
- 37 Phillip St