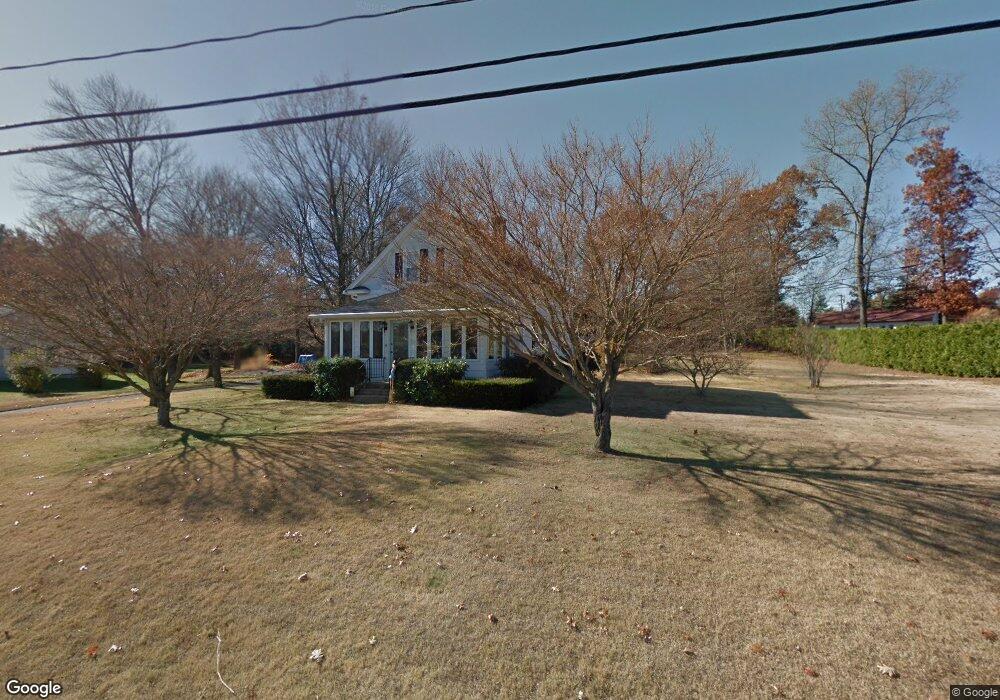
14 Strong St Easthampton, MA 01027
Estimated Value: $360,238 - $388,000
3
Beds
2
Baths
1,197
Sq Ft
$311/Sq Ft
Est. Value
About This Home
This home is located at 14 Strong St, Easthampton, MA 01027 and is currently estimated at $372,060, approximately $310 per square foot. 14 Strong St is a home located in Hampshire County with nearby schools including Easthampton High School, Hilltown Cooperative Charter Public School, and Calvary Baptist Christian School.
Ownership History
Date
Name
Owned For
Owner Type
Purchase Details
Closed on
Jul 19, 2024
Sold by
Carrier
Bought by
Evans Pamela E
Current Estimated Value
Purchase Details
Closed on
Jan 17, 2008
Sold by
Gawle Phyllis M
Bought by
Gawle Stanley and Gawle Phyllis
Purchase Details
Closed on
Dec 10, 2002
Sold by
Gawle Phyliss M and Gawle Stanley J
Bought by
Hardy D D
Create a Home Valuation Report for This Property
The Home Valuation Report is an in-depth analysis detailing your home's value as well as a comparison with similar homes in the area
Home Values in the Area
Average Home Value in this Area
Purchase History
| Date | Buyer | Sale Price | Title Company |
|---|---|---|---|
| Evans Pamela E | -- | None Available | |
| Evans Pamela E | -- | None Available | |
| Gawle Stanley | -- | -- | |
| Hardy D D | $55,000 | -- | |
| Stanley | -- | -- | |
| Hardy D D | $55,000 | -- |
Source: Public Records
Tax History
| Year | Tax Paid | Tax Assessment Tax Assessment Total Assessment is a certain percentage of the fair market value that is determined by local assessors to be the total taxable value of land and additions on the property. | Land | Improvement |
|---|---|---|---|---|
| 2025 | $4,083 | $298,700 | $121,900 | $176,800 |
| 2024 | $3,942 | $290,700 | $118,400 | $172,300 |
| 2023 | $3,041 | $207,600 | $93,800 | $113,800 |
| 2022 | $3,432 | $207,600 | $93,800 | $113,800 |
| 2021 | $3,741 | $213,300 | $93,800 | $119,500 |
| 2020 | $3,687 | $207,600 | $93,800 | $113,800 |
| 2019 | $3,053 | $197,500 | $93,800 | $103,700 |
| 2018 | $2,965 | $185,300 | $89,400 | $95,900 |
| 2017 | $2,892 | $178,400 | $85,900 | $92,500 |
| 2016 | $2,764 | $177,300 | $85,900 | $91,400 |
| 2015 | $2,686 | $177,300 | $85,900 | $91,400 |
Source: Public Records
Map
Nearby Homes
Your Personal Tour Guide
Ask me questions while you tour the home.