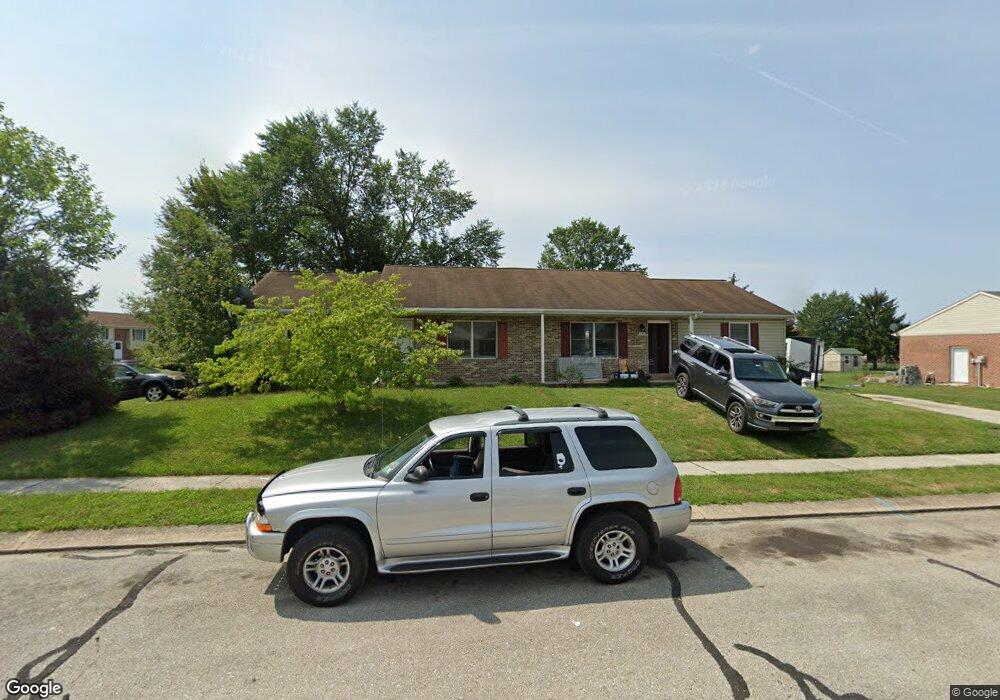
14 Sycamore Ln Unit 65 Hanover, PA 17331
Midway NeighborhoodEstimated Value: $192,000 - $240,432
2
Beds
2
Baths
1,050
Sq Ft
$207/Sq Ft
Est. Value
About This Home
This home is located at 14 Sycamore Ln Unit 65, Hanover, PA 17331 and is currently estimated at $217,858, approximately $207 per square foot. 14 Sycamore Ln Unit 65 is a home located in Adams County with nearby schools including New Oxford Senior High School, St. Teresa of Calcutta Catholic School - McSherrystown Campus, and St. Teresa of Calcutta Catholic School - Conewago Campus.
Ownership History
Date
Name
Owned For
Owner Type
Purchase Details
Closed on
Aug 19, 2024
Sold by
Mehaffie Shawn
Bought by
Luckenbaugh Sheila A
Current Estimated Value
Home Financials for this Owner
Home Financials are based on the most recent Mortgage that was taken out on this home.
Original Mortgage
$218,500
Outstanding Balance
$216,065
Interest Rate
6.95%
Mortgage Type
New Conventional
Estimated Equity
$1,793
Purchase Details
Closed on
Aug 24, 2020
Sold by
Ness Frederick H and Ness Loretta M
Bought by
Mehaffie Shawn
Home Financials for this Owner
Home Financials are based on the most recent Mortgage that was taken out on this home.
Original Mortgage
$118,000
Interest Rate
2.9%
Mortgage Type
Seller Take Back
Purchase Details
Closed on
Aug 1, 1988
Bought by
Ness Frederick H
Create a Home Valuation Report for This Property
The Home Valuation Report is an in-depth analysis detailing your home's value as well as a comparison with similar homes in the area
Home Values in the Area
Average Home Value in this Area
Purchase History
| Date | Buyer | Sale Price | Title Company |
|---|---|---|---|
| Luckenbaugh Sheila A | $230,000 | Jpl Settlement Services Llc | |
| Mehaffie Shawn | $120,000 | None Available | |
| Ness Frederick H | $21,200 | -- |
Source: Public Records
Mortgage History
| Date | Status | Borrower | Loan Amount |
|---|---|---|---|
| Open | Luckenbaugh Sheila A | $218,500 | |
| Previous Owner | Mehaffie Shawn | $118,000 |
Source: Public Records
Tax History Compared to Growth
Tax History
| Year | Tax Paid | Tax Assessment Tax Assessment Total Assessment is a certain percentage of the fair market value that is determined by local assessors to be the total taxable value of land and additions on the property. | Land | Improvement |
|---|---|---|---|---|
| 2025 | $2,910 | $121,500 | $32,500 | $89,000 |
| 2024 | $2,670 | $120,700 | $32,500 | $88,200 |
| 2023 | $2,571 | $120,700 | $32,500 | $88,200 |
| 2022 | $2,492 | $120,700 | $32,500 | $88,200 |
| 2021 | $2,429 | $120,700 | $32,500 | $88,200 |
| 2020 | $2,432 | $120,700 | $32,500 | $88,200 |
| 2019 | $2,323 | $120,700 | $32,500 | $88,200 |
| 2018 | $2,274 | $120,700 | $32,500 | $88,200 |
| 2017 | $2,180 | $120,700 | $32,500 | $88,200 |
| 2016 | -- | $120,700 | $32,500 | $88,200 |
| 2015 | -- | $120,700 | $32,500 | $88,200 |
| 2014 | -- | $120,700 | $32,500 | $88,200 |
Source: Public Records
Map
Nearby Homes
- 254 Princess St
- 213 S Madison St
- 85 South St
- 221 Princess St
- 3 Sprenkle Ave
- 23 Young Cir
- 362 High St
- 372 Maple Ave
- 348 High St
- 3 Pine St
- 463 4631/2 High St
- 1012 W Elm Ave
- 10 Bear Cir Unit 29
- 31 4th St
- 617 N Blettner Ave Unit 120
- 564 N Franklin St
- 718 Linden Ave
- 523 Frederick St
- 522 Frederick St
- 13 N Blettner Ave
- 12 Sycamore Ln Unit 66
- 16 Sycamore Ln Unit 64
- 9 Dogwood Ln Unit 67
- 18 Sycamore Ln Unit 63
- 11 Dogwood Ln Unit 68
- 6 Sycamore Ln Unit 2
- 20 Sycamore Ln Unit 62
- 13 Sycamore Ln Unit 80
- 15 Sycamore Ln Unit 81
- 11 Sycamore Ln Unit 79
- 6 Dogwood Ln Unit 3
- 15 Dogwood Ln Unit 69
- 17 Sycamore Ln Unit 82
- 8 Dogwood Ln Unit 4
- 9 Sycamore Ln Unit 78
- 4 Sycamore Ln Unit 1
- 19 Sycamore Ln
- 517 Poplar St Unit 73
- 22 Sycamore Ln Unit 61
- 12 Dogwood Ln Unit 5