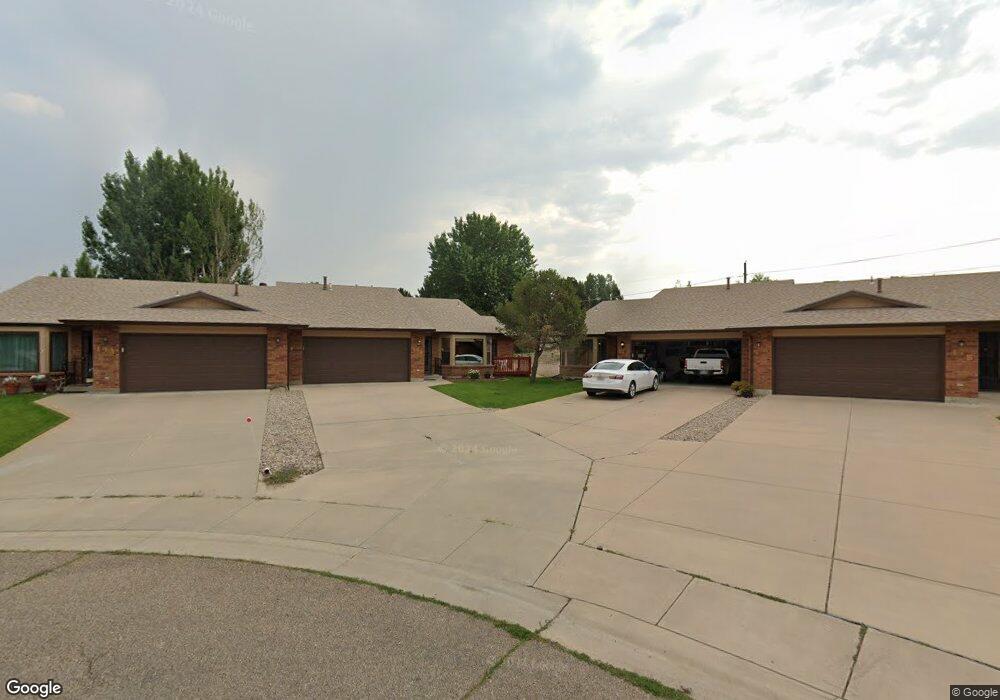
14 Towerbridge Ct Unit B Pueblo, CO 81001
Belmont NeighborhoodEstimated Value: $305,356 - $468,000
3
Beds
2
Baths
1,878
Sq Ft
$191/Sq Ft
Est. Value
About This Home
This home is located at 14 Towerbridge Ct Unit B, Pueblo, CO 81001 and is currently estimated at $358,089, approximately $190 per square foot. 14 Towerbridge Ct Unit B is a home located in Pueblo County with nearby schools including Belmont Elementary School, Heaton Middle School, and East High School.
Ownership History
Date
Name
Owned For
Owner Type
Purchase Details
Closed on
Oct 13, 2009
Sold by
Garascia Charles and Garascia Sandra
Bought by
The Charles P Garascia Trust
Current Estimated Value
Purchase Details
Closed on
Jan 29, 2009
Sold by
Davenport Gregory T and Parker Terri D
Bought by
Garascia Charles and Garascia Sandra
Purchase Details
Closed on
Oct 18, 2005
Sold by
Davenport O J
Bought by
Davenport O J and Davenport Gregory T
Purchase Details
Closed on
Apr 24, 1996
Sold by
Kellog William L
Bought by
Davenport O J
Purchase Details
Closed on
Sep 4, 1992
Sold by
Champion Real Estate Inc
Bought by
Kellog William L
Purchase Details
Closed on
Jun 28, 1990
Bought by
Champion Real Estate Inc
Purchase Details
Closed on
Jan 29, 1990
Sold by
Ladd John I
Purchase Details
Closed on
Sep 28, 1989
Bought by
Ladd John I
Create a Home Valuation Report for This Property
The Home Valuation Report is an in-depth analysis detailing your home's value as well as a comparison with similar homes in the area
Home Values in the Area
Average Home Value in this Area
Purchase History
| Date | Buyer | Sale Price | Title Company |
|---|---|---|---|
| The Charles P Garascia Trust | -- | None Available | |
| Garascia Charles | $163,000 | Stewart Title | |
| Davenport O J | -- | -- | |
| Davenport O J | $152,000 | -- | |
| Kellog William L | $139,000 | -- | |
| Champion Real Estate Inc | -- | -- | |
| -- | -- | -- | |
| Ladd John I | -- | -- |
Source: Public Records
Tax History Compared to Growth
Tax History
| Year | Tax Paid | Tax Assessment Tax Assessment Total Assessment is a certain percentage of the fair market value that is determined by local assessors to be the total taxable value of land and additions on the property. | Land | Improvement |
|---|---|---|---|---|
| 2024 | $1,170 | $18,480 | -- | -- |
| 2023 | $1,183 | $22,170 | $1,010 | $21,160 |
| 2022 | $1,094 | $17,834 | $1,040 | $16,794 |
| 2021 | $1,128 | $18,350 | $1,070 | $17,280 |
| 2020 | $816 | $18,350 | $1,070 | $17,280 |
| 2019 | $1,526 | $15,114 | $708 | $14,406 |
| 2018 | $1,145 | $12,638 | $713 | $11,925 |
| 2017 | $1,121 | $12,638 | $713 | $11,925 |
| 2016 | $1,085 | $11,947 | $788 | $11,159 |
| 2015 | $1,081 | $11,947 | $788 | $11,159 |
| 2014 | $969 | $10,679 | $788 | $9,891 |
Source: Public Records
Map
Nearby Homes
- 6 Crownbridge Ct
- 130 Scotland Rd Unit D
- 172 Bonnymede Rd
- 172 Bonnymede Rd Unit A
- 172 Bonnymede Rd Unit C
- 13 Ironbridge Ln
- 146 Montebello Rd
- 2 Alan Shepard Rd Unit 8
- 55 Bonnymede Rd Unit S
- 55 Bonnymede Rd
- 136 Douglas Ln
- 2 Hilton Ln
- 5 Douglas Ln
- 146 Douglas Ln
- 6 Pineridge Ct
- 39 Apollo Ln
- 36 Scotland Rd
- 62 Louis Nelson Rd
- 59 Villa Dr
- 17 Heaton Place
- 14 Towerbridge Ct Unit A
- 14 Towerbridge Ct
- 12 Towerbridge Ct Unit A
- 12 Towerbridge Ct Unit B
- 17 Towerbridge Ct Unit A
- 17 Towerbridge Ct Unit B
- 9 Crownbridge Ct
- 11 Crownbridge Ct
- 10 Towerbridge Ct
- 15 Towerbridge Ct Unit B
- 15 Towerbridge Ct
- 15 Towerbridge Ct Unit B
- 15 Towerbridge Ct
- 7 Crownbridge Ct
- 11 Towerbridge Ct Unit A
- 11 Towerbridge Ct Unit B
- 8 Towerbridge Ct
- 191 Bonnymede Rd Unit 197
- 191 Bonnymede Rd Unit 191-197 Bonnymede Rd
- 199 Bonnymede Rd Unit 205