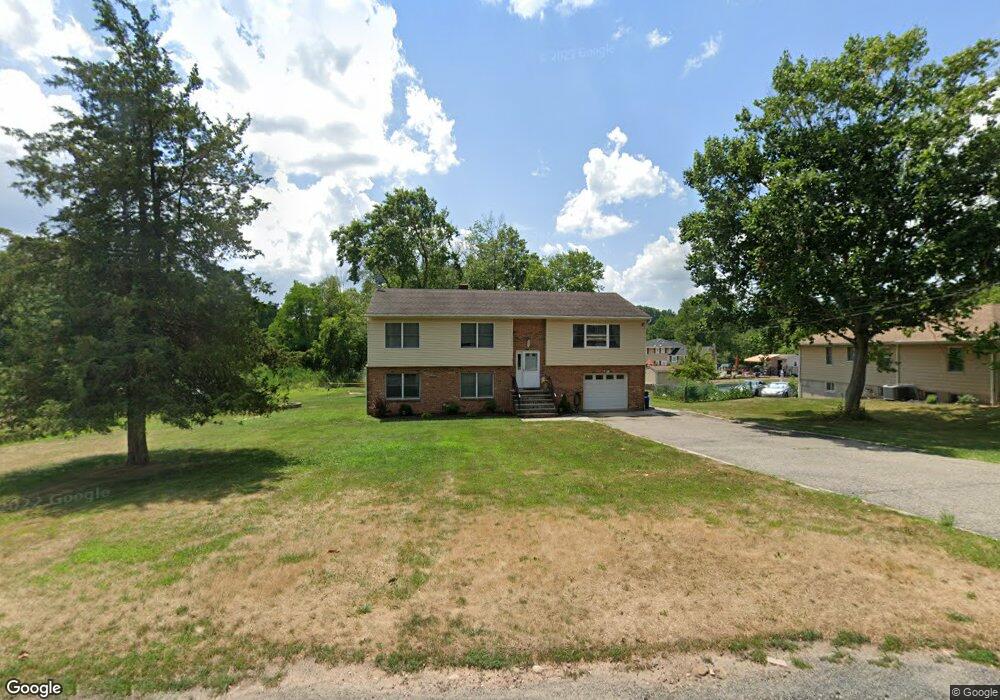
14 Troy Rd Whippany, NJ 07981
Estimated Value: $862,392 - $892,000
4
Beds
3
Baths
2,746
Sq Ft
$319/Sq Ft
Est. Value
About This Home
This home is located at 14 Troy Rd, Whippany, NJ 07981 and is currently estimated at $875,598, approximately $318 per square foot. 14 Troy Rd is a home located in Morris County with nearby schools including Whippany Park High School, Arrow Academy, and The Morristown-Beard School.
Ownership History
Date
Name
Owned For
Owner Type
Purchase Details
Closed on
Oct 19, 2021
Sold by
Barisciano Pasquale and Barisciano Mario
Bought by
Lenox Daniel J and Lenox Charis Milani
Current Estimated Value
Home Financials for this Owner
Home Financials are based on the most recent Mortgage that was taken out on this home.
Original Mortgage
$540,038
Outstanding Balance
$494,509
Interest Rate
3.09%
Mortgage Type
FHA
Estimated Equity
$381,090
Purchase Details
Closed on
Aug 3, 2010
Sold by
Barisciano Frank
Bought by
Barisciano Pasquale and Barisciano Mario
Purchase Details
Closed on
Nov 20, 1998
Sold by
Barisciano Assunta Michele
Bought by
Barisciano Assunta Michele and Barisicano Frank
Purchase Details
Closed on
Oct 11, 1998
Sold by
Barisciano Mario and Barisciano Antonio
Bought by
Barisciano Assunta Michele
Create a Home Valuation Report for This Property
The Home Valuation Report is an in-depth analysis detailing your home's value as well as a comparison with similar homes in the area
Home Values in the Area
Average Home Value in this Area
Purchase History
| Date | Buyer | Sale Price | Title Company |
|---|---|---|---|
| Lenox Daniel J | $550,000 | Chicago Title Insurance Co | |
| Barisciano Pasquale | $200,000 | None Available | |
| Barisciano Assunta Michele | -- | -- | |
| Barisciano Assunta Michele | -- | -- |
Source: Public Records
Mortgage History
| Date | Status | Borrower | Loan Amount |
|---|---|---|---|
| Open | Lenox Daniel J | $540,038 |
Source: Public Records
Tax History Compared to Growth
Tax History
| Year | Tax Paid | Tax Assessment Tax Assessment Total Assessment is a certain percentage of the fair market value that is determined by local assessors to be the total taxable value of land and additions on the property. | Land | Improvement |
|---|---|---|---|---|
| 2025 | $10,308 | $489,000 | $210,800 | $278,200 |
| 2024 | $10,264 | $489,000 | $210,800 | $278,200 |
| 2023 | $10,264 | $489,000 | $210,800 | $278,200 |
| 2022 | $9,389 | $489,000 | $210,800 | $278,200 |
| 2021 | $9,389 | $489,000 | $210,800 | $278,200 |
| 2020 | $9,223 | $489,000 | $210,800 | $278,200 |
| 2019 | $9,252 | $489,000 | $210,800 | $278,200 |
| 2018 | $9,091 | $489,000 | $210,800 | $278,200 |
| 2017 | $8,822 | $489,000 | $210,800 | $278,200 |
| 2016 | $8,694 | $489,000 | $210,800 | $278,200 |
| 2015 | $8,347 | $489,000 | $210,800 | $278,200 |
| 2014 | $8,166 | $489,000 | $210,800 | $278,200 |
Source: Public Records
Map
Nearby Homes
- 26 David Dr
- 00 Algonquin Pkwy
- 11 Nemic Ln
- 45 Polhemus Terrace
- 74 Preston Rd
- 39 Lefke Ln
- 72 Schindler Ct
- 89 Schindler Ct
- 96 Parsippany Rd
- 21 Weaver Place
- 2003 Vermont Terrace Unit 2003
- 53 Westminster Dr
- 92 Sunrise Dr
- 26 Gladstone Ct
- 42 Gladstone Ct
- 34 Gladstone Ct
- 14 Gladstone Ct
- Monterey Plan at The Grove - The Monterey Collection
- Pershing Plan at The Grove - The Pershing Collection
- 19 Petry Dr