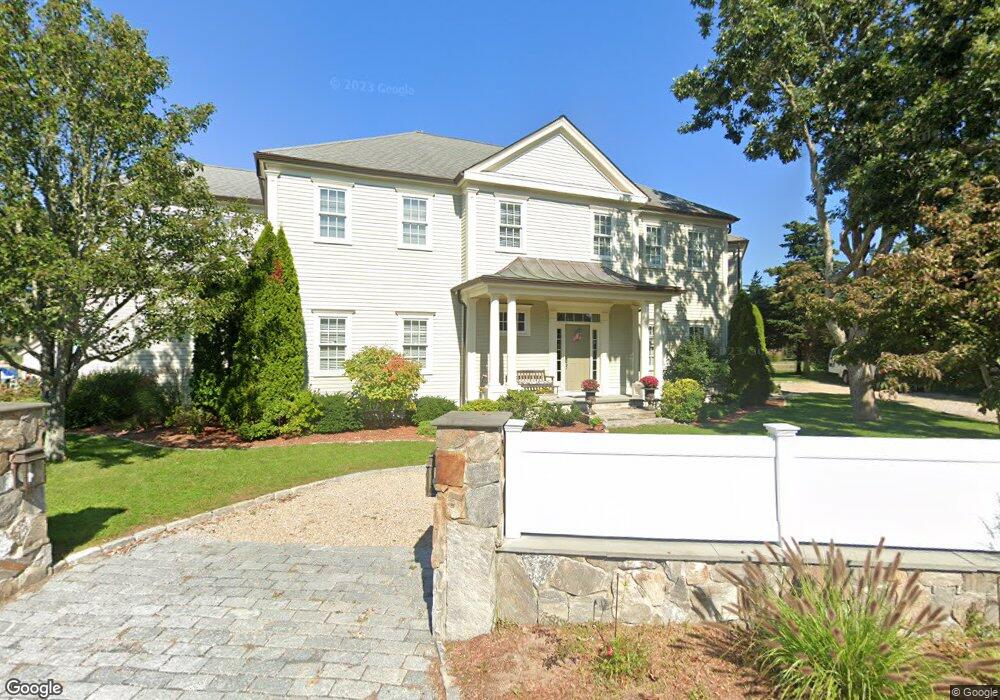
14 Uncle Freemans Rd West Dennis, MA 02670
West Dennis NeighborhoodEstimated Value: $3,319,000 - $3,700,925
4
Beds
5
Baths
5,466
Sq Ft
$641/Sq Ft
Est. Value
About This Home
This home is located at 14 Uncle Freemans Rd, West Dennis, MA 02670 and is currently estimated at $3,505,642, approximately $641 per square foot. 14 Uncle Freemans Rd is a home located in Barnstable County with nearby schools including Dennis-Yarmouth Regional High School and St. Pius X. School.
Ownership History
Date
Name
Owned For
Owner Type
Purchase Details
Closed on
Mar 19, 2018
Sold by
Oluing Ft and Long
Bought by
Oluring Ft and Long
Current Estimated Value
Purchase Details
Closed on
Feb 23, 2012
Sold by
Long James L and Long Stephen
Bought by
Owing Ft and Long
Home Financials for this Owner
Home Financials are based on the most recent Mortgage that was taken out on this home.
Original Mortgage
$405,000
Interest Rate
3.89%
Mortgage Type
New Conventional
Purchase Details
Closed on
Oct 8, 2008
Sold by
Long James L and Long Stephen M
Bought by
Long James L and Long Nancy E
Purchase Details
Closed on
Aug 30, 2002
Sold by
Uncle Freemans Rd T and Uncle Dwyer
Bought by
Long James L
Create a Home Valuation Report for This Property
The Home Valuation Report is an in-depth analysis detailing your home's value as well as a comparison with similar homes in the area
Home Values in the Area
Average Home Value in this Area
Purchase History
| Date | Buyer | Sale Price | Title Company |
|---|---|---|---|
| Oluring Ft | -- | -- | |
| Oluring Ft | -- | -- | |
| Owing Ft | -- | -- | |
| Long James L | -- | -- | |
| Long James L | -- | -- | |
| Long James L | -- | -- | |
| Long James L | -- | -- | |
| Long James L | -- | -- | |
| Long James L | $880,000 | -- | |
| Long James L | $880,000 | -- |
Source: Public Records
Mortgage History
| Date | Status | Borrower | Loan Amount |
|---|---|---|---|
| Previous Owner | Long James L | $405,000 |
Source: Public Records
Tax History Compared to Growth
Tax History
| Year | Tax Paid | Tax Assessment Tax Assessment Total Assessment is a certain percentage of the fair market value that is determined by local assessors to be the total taxable value of land and additions on the property. | Land | Improvement |
|---|---|---|---|---|
| 2025 | $15,031 | $3,471,400 | $1,594,500 | $1,876,900 |
| 2024 | $15,439 | $3,516,800 | $1,533,400 | $1,983,400 |
| 2023 | $14,310 | $3,064,300 | $1,393,900 | $1,670,400 |
| 2022 | $13,227 | $2,361,900 | $1,076,300 | $1,285,600 |
| 2021 | $3,336 | $2,318,800 | $1,123,800 | $1,195,000 |
| 2020 | $12,883 | $2,112,000 | $1,018,900 | $1,093,100 |
| 2019 | $13,198 | $2,139,000 | $1,060,100 | $1,078,900 |
| 2018 | $6,829 | $1,972,100 | $1,009,200 | $962,900 |
| 2017 | $2,538 | $1,972,100 | $1,009,200 | $962,900 |
| 2016 | $12,773 | $1,956,000 | $1,120,500 | $835,500 |
| 2015 | $12,518 | $1,956,000 | $1,120,500 | $835,500 |
| 2014 | $12,958 | $2,040,600 | $1,120,500 | $920,100 |
Source: Public Records
Map
Nearby Homes
- 2 Rita Mary Way
- 308 Old Main St
- 181 Pleasant St
- 40 Kelley Rd
- 45 Seth Ln
- 22 Powhatan Rd
- 14 Schoolhouse Ln
- 209 Main St Unit 3
- 209 Main St Unit 6
- 209 Main St Unit 1
- 209 Main St Unit 2
- 209 Main St Unit 4
- 209 Main St Unit 5
- 15 Sharon Rd
- 29 Bass River Rd
- 18 Turner Ln
- 23 Doric Ave
- 7 Sunset Pines Rd
- 116 N Main St
- 745 Willow St
- 27 Uncle Freemans Rd
- 10 Uncle Freemans Rd
- 23 Uncle Freemans Rd
- 11 Uncle Freemans Rd
- 115 Uncle Barneys Rd
- 2 Uncle Freemans Rd
- 127 Uncle Barneys Rd
- 10 Quaker Ln
- 133 Uncle Barneys Rd
- 105 Uncle Barneys Rd
- 0 Uncle Barneys Rd
- 9 Quaker Ln
- 61 Chase Ave
- 79 Chase Ave
- 67 Chase Ave
- 57 Chase Ave
- 118 Uncle Barneys Rd
- 124 Uncle Barneys Rd
- 134 Uncle Barneys Rd
- 112 Uncle Barneys Rd