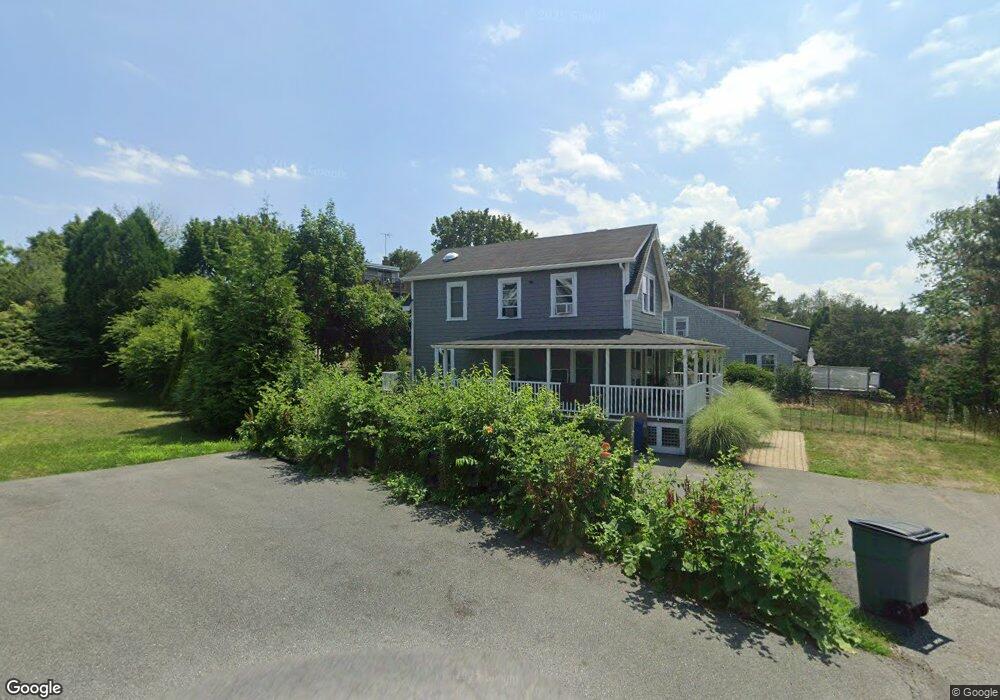
14 Upland Rd Marblehead, MA 01945
Estimated Value: $685,399 - $801,000
3
Beds
1
Bath
1,170
Sq Ft
$624/Sq Ft
Est. Value
About This Home
This home is located at 14 Upland Rd, Marblehead, MA 01945 and is currently estimated at $729,850, approximately $623 per square foot. 14 Upland Rd is a home located in Essex County with nearby schools including Marblehead High School, Marblehead Community Charter Public School, and Tower School.
Ownership History
Date
Name
Owned For
Owner Type
Purchase Details
Closed on
Sep 30, 2021
Sold by
Reddy Sarah and Reddy Thomas
Bought by
Reddy Sarah
Current Estimated Value
Home Financials for this Owner
Home Financials are based on the most recent Mortgage that was taken out on this home.
Original Mortgage
$420,000
Outstanding Balance
$378,821
Interest Rate
2.8%
Mortgage Type
New Conventional
Estimated Equity
$351,029
Purchase Details
Closed on
Jun 13, 2016
Sold by
Broderick Paul
Bought by
Reddy Thomas and Reddy Sarah
Home Financials for this Owner
Home Financials are based on the most recent Mortgage that was taken out on this home.
Original Mortgage
$400,000
Interest Rate
3.66%
Mortgage Type
VA
Create a Home Valuation Report for This Property
The Home Valuation Report is an in-depth analysis detailing your home's value as well as a comparison with similar homes in the area
Home Values in the Area
Average Home Value in this Area
Purchase History
| Date | Buyer | Sale Price | Title Company |
|---|---|---|---|
| Reddy Sarah | -- | None Available | |
| Reddy Sarah | -- | None Available | |
| Reddy Sarah | -- | None Available | |
| Reddy Sarah | -- | None Available | |
| Reddy Thomas | $400,000 | -- |
Source: Public Records
Mortgage History
| Date | Status | Borrower | Loan Amount |
|---|---|---|---|
| Open | Reddy Sarah | $420,000 | |
| Closed | Reddy Sarah | $420,000 | |
| Previous Owner | Reddy Thomas | $400,000 |
Source: Public Records
Tax History
| Year | Tax Paid | Tax Assessment Tax Assessment Total Assessment is a certain percentage of the fair market value that is determined by local assessors to be the total taxable value of land and additions on the property. | Land | Improvement |
|---|---|---|---|---|
| 2025 | $5,296 | $585,200 | $472,300 | $112,900 |
| 2024 | $5,284 | $589,700 | $507,700 | $82,000 |
| 2023 | $5,404 | $540,400 | $442,800 | $97,600 |
| 2022 | $5,117 | $486,400 | $389,700 | $96,700 |
| 2021 | $4,804 | $461,000 | $377,900 | $83,100 |
| 2020 | $4,552 | $438,100 | $366,000 | $72,100 |
| 2019 | $4,491 | $418,200 | $342,400 | $75,800 |
| 2018 | $4,479 | $406,400 | $330,600 | $75,800 |
| 2017 | $4,054 | $368,200 | $295,200 | $73,000 |
| 2016 | $3,835 | $345,500 | $271,600 | $73,900 |
| 2015 | $3,648 | $329,200 | $259,800 | $69,400 |
| 2014 | $3,227 | $291,000 | $224,400 | $66,600 |
Source: Public Records
Map
Nearby Homes
- 30 Haley Rd Unit 1
- 1 Knollwood Rd
- 70 Maverick St
- 6 Mount Vernon St
- 55 Roosevelt Ave
- 33 W Shore Dr
- 282 Pleasant St
- 290 Washington St Unit A
- 9 Lincoln Park
- 7 Cottage St
- 21 Kenneth Rd
- 132 Elm St
- 132 Elm St Unit 132
- 157 Green St Unit 3
- 1 Shore Ave
- 41 Atlantic Ave Unit 1
- 4 Fairview Rd
- 66 Pleasant St Unit 1
- 66 Pleasant St Unit 2
- 23 Wyman Rd
Your Personal Tour Guide
Ask me questions while you tour the home.