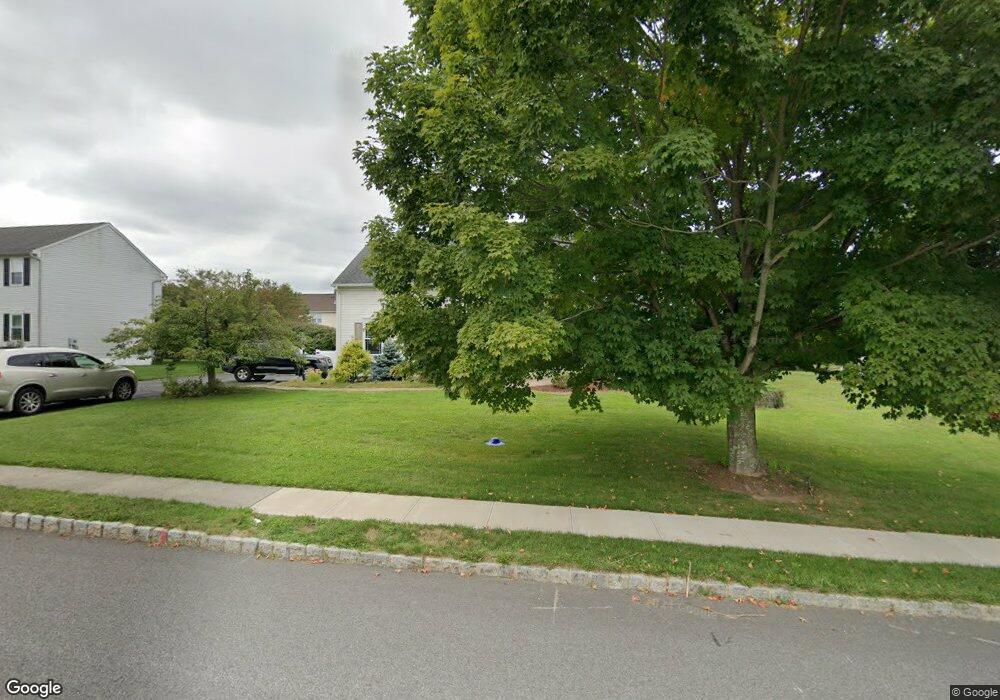
14 van Nest Oxford, NJ 07863
Estimated Value: $478,000 - $570,000
--
Bed
--
Bath
2,018
Sq Ft
$261/Sq Ft
Est. Value
About This Home
This home is located at 14 van Nest, Oxford, NJ 07863 and is currently estimated at $527,190, approximately $261 per square foot. 14 van Nest is a home located in Warren County with nearby schools including Oxford Central School.
Ownership History
Date
Name
Owned For
Owner Type
Purchase Details
Closed on
Jul 1, 2002
Sold by
Natishan John M and Natishan Jacqueline G
Bought by
Murphy Joseph G and Murphy Karen A
Current Estimated Value
Home Financials for this Owner
Home Financials are based on the most recent Mortgage that was taken out on this home.
Original Mortgage
$199,900
Outstanding Balance
$85,222
Interest Rate
6.79%
Estimated Equity
$441,968
Purchase Details
Closed on
Apr 29, 1998
Sold by
Skylands Development Ltd Partnership
Bought by
Natishan John M
Home Financials for this Owner
Home Financials are based on the most recent Mortgage that was taken out on this home.
Original Mortgage
$159,050
Interest Rate
7.05%
Create a Home Valuation Report for This Property
The Home Valuation Report is an in-depth analysis detailing your home's value as well as a comparison with similar homes in the area
Home Values in the Area
Average Home Value in this Area
Purchase History
| Date | Buyer | Sale Price | Title Company |
|---|---|---|---|
| Murphy Joseph G | $299,900 | -- | |
| Natishan John M | $198,850 | -- |
Source: Public Records
Mortgage History
| Date | Status | Borrower | Loan Amount |
|---|---|---|---|
| Open | Murphy Joseph G | $199,900 | |
| Previous Owner | Natishan John M | $159,050 |
Source: Public Records
Tax History Compared to Growth
Tax History
| Year | Tax Paid | Tax Assessment Tax Assessment Total Assessment is a certain percentage of the fair market value that is determined by local assessors to be the total taxable value of land and additions on the property. | Land | Improvement |
|---|---|---|---|---|
| 2025 | $12,054 | $248,700 | $43,500 | $205,200 |
| 2024 | $11,099 | $248,700 | $43,500 | $205,200 |
| 2023 | $10,910 | $248,700 | $43,500 | $205,200 |
| 2022 | $10,910 | $248,700 | $43,500 | $205,200 |
| 2021 | $10,199 | $248,700 | $43,500 | $205,200 |
| 2020 | $10,376 | $248,700 | $43,500 | $205,200 |
| 2019 | $9,988 | $248,700 | $43,500 | $205,200 |
| 2018 | $9,988 | $248,700 | $43,500 | $205,200 |
| 2017 | $9,766 | $248,700 | $43,500 | $205,200 |
| 2016 | $9,824 | $248,700 | $43,500 | $205,200 |
| 2015 | $7,862 | $253,200 | $82,000 | $171,200 |
| 2014 | $9,266 | $308,400 | $82,000 | $226,400 |
Source: Public Records
Map
Nearby Homes
- 21 Olde Forge
- 77 Shippen Ridge
- 349 New Jersey 31
- 301 New Jersey 31
- 9 Hillside Village
- 305 Route 31
- 1497 New Jersey 31
- 120 Axford Ave
- 46 Back St
- 11 Front St
- 9 Front St
- 59 Back St
- 14 Tamarack Rd
- 121 New St
- 125 Free Union Rd
- 5 Orams Ln
- 123 Free Union Rd
- 8 Buttzville Rd
- 7 Buttzville Ct
- 145 Quenby Mountain Rd